Are Student Achievement and Poverty Related?
Why is this question important?
Hundred of millions of dollars and hours are invested each year on educational programs targeting students of low socio-economic status to boost their achievement levels.
See further discussion below.
Sources: Test Scores – Data Explorer, National Assessment of Educational Progress (NAEP), National Center for Education Statistics (NCES), Institute for Education Sciences (IES), U.S. Department of Education, http://nces.ed.gov/nationsreportcard/nde/criteria.asp (8th grade, average scale score, public schools, 2005 results)
National Lunch Program Eligibility: Digest of Education Statistics (2008), National Center for Education Statistics (NCES), Institute for Education Sciences (IES), U.S. Department of Education, http://nces.ed.gov/programs/digest/d08/tables/dt08_042.asp (2005-06)
Results:
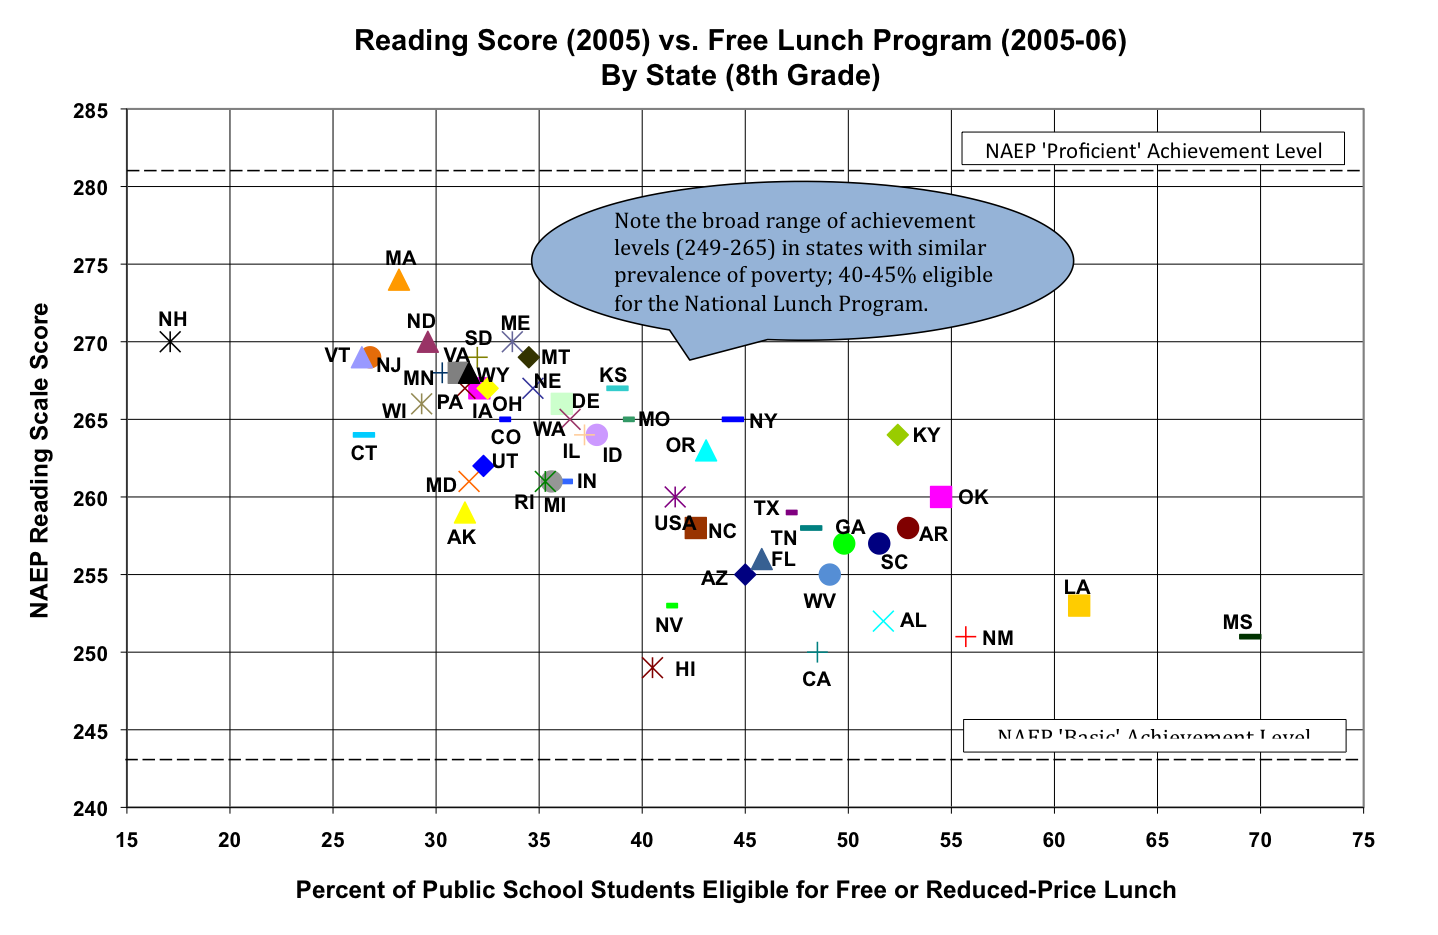
- There is a high correlation between both 8th grade reading and math scores and poverty, as measured by the percent of public school students in a state eligible for the National Free and Reduce-Price School Lunch Program.
- Within small ranges of poverty levels, there is a significant range of student achievement. For example, for states with eligibility between 40 and 45%, reading scores range from 249 to 265 and math scores range from 266 to 282, indicating some states are better able to teach their students, given a particular poverty level.
- The average test scores of all of the states is below the NAEP definition of ‘Proficient’ achievement level in both reading and math.
- The average test scores of all the states is above the NAEP definition of ‘Basic’ achievement level in both reading and math, except for Mississippi and Alabama in math, which are right at the Basic math level.
Implications: Clearly, there is a close relationship between poverty and student test scores. Given a student population at a particular poverty level, there is quite a range of performance levels achievable by various state education systems.
- Could states with lower achievement levels for a particular poverty level learn something from higher-achieving states with similar poverty levels?
- The average student in all states are not achieving up to the NAEP ‘Proficient’ level in either reading or math. What will it take to move the average performer to this level?
- Some states are dangerously close to having average students achieve below even the NAEP ‘Basic’ achievement level. Can these states do better, given the poverty level of their student populations?
Authors:
National Center for Educational Statistics, Institute for Education Sciences, U.S. Department of Education
Publishers:
National Center for Educational Statistics, Institute for Education Sciences, U.S. Department of Education
Study Description:
The analysis compares National Free and Reduce-Price School Lunch Program Eligibility data obtained from the National Center for Education Statistics (NCES) Digest of Education Statistics (2008) with NAEP Reading and Math score data from NCES Data Explorer. This data was used to produce scattergrams of 8th grade Reading vs. Percent Eligible for Lunch Program by state and 8th grade Math vs. Percent Eligible for Lunch Program by state.