What is the student academic performance impact of TV and video watching on school nights?
Why is this question important? Students have limited time to divide between activities on school days. Knowing how TV and video watching is generally related to school performance can help them and their parents make informed decisions.
See further discussion below.
Source: National Assessment of Educational Progress Data Explorer
http://nces.ed.gov/nationsreportcard/lttdata/
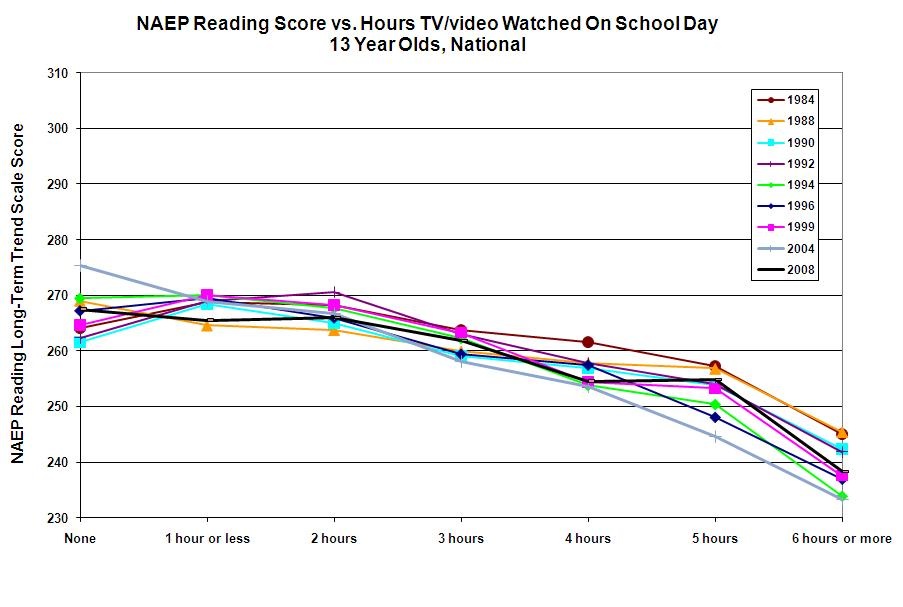
Results: Strong correlation between NAEP Reading Long-Term Trend Scale Score and TV/video watching greater than 2 hours on school nights, with more hours watching corresponding to lower scores. Slight improvement over period for students reporting no TV watching. Little change over time for students reporting 1 or 2 hours watching TV. General trend toward lower scores between 1984 and 2004 for students reporting 3 or more hours watching TV. Some improvement for these students between 2004 and 2008.
Implications: Generally less TV and video watching on school nights corresponds with better reading scores. General downward trend in scores over time for students reporting 3 or more hours of TV watching per school night. It is important to note that causation cannot be inferred from these data.
Authors: National Assessment of Educational Progress, Institute of Education Sciences, National Center for Education Statistics, U.S. Department of Education
Publisher: National Assessment of Educational Progress, Institute of Education Sciences, National Center for Education Statistics, U.S. Department of Education
Study Description: The NAEP long-term reading assessment was designed to measure students' ability to 1) locate specific information, 2) make inferences base on information in two or more parts of a passage, and 3) identify the main idea in a passage. Students' comprehension was assessed with both multiple-choice and constructed-response questions.
As part of the NAEP assessment, student questionnaires collect information on students' demographic characteristics, classroom experiences, and educational support. Teacher qustionnaires gather data on teacher background, training, and instructional practices (for grades 4 and 8). School questionnaires, completed by principals or assistant principals, gather information on school policies and characteristics. Questionnaires for students with disabilities or English language learners (SD/ELL), completed by special education or English language teachers, collect information about students who have disabilities or limited English proficiency.
From approximately 27,700 students who took the reading assessment, NCES makes a multi-stage sampling of scores, first from representative geographies, then from representative schools, both public and nonpublic, then randomly selecting students within selected schools.
Results from the long term reading assessment were grouped based on how students answered the background question, 'On a school day, about how many hours do you usually watch TV or videotapes outside of school hours?'
Possible answers were: None, 1 hour or less, 2 hours, 3 hours, 4 hours, 5 hours, 6 hours or more, Omitted (no answer).
Definitions:
NAEP = National Assessment of Educational Progress
NCES = National Center for Education Statistics
SD = Students with disabilities
ELL = English Language Learners
Variables:
Subject: Long-Term Trend Reading
Measure: Long-Term Trend scale
Age: 13
Jurisdiction: National
Years: 84, 88, 90, 92, 94, 96, 99, 04, 08
Factors Beyond School|Time use outside of school|Amount of TV/video watched on school day