Does principal turnover correlate with a school's socio-economic status?
Why is this question important? A critical feature of an effective education system is equity of resources and outcomes across schools, regardless of student demographics. One of the most important student demographic measures is student socio-economic status (SES). Schools can be identified as higher or lower SES schools by the percentage of students who qualify for the National School Lunch Program (also referred to as the free or reduced-price lunch program, or FRLP). Children may qualify for either free or reduced-price lunch based on family income; free lunch eligibility represents the lowest income families.
School principals are the second most important school-related resource, after teachers, in influencing student performance, accounting for about a quarter of total school effects (Marzano, Waters, & McNulty, 2005). There is increasingly clear evidence as to which practices of principals are associated with teaching effectiveness, student achievement, and high-performing schools (Robinson, Lloyd, & Rowe, 2008). Research suggests that the turnover rate among principals can have a significant impact on the quality of school performance. It can lead to greater teacher turnover (Béteille, Kalogrides, & Loeb, 2012), have a direct negative effect on student and school achievement (Burkhauser, Gates, Hamilton, & Ikemoto, 2012), and prevent large-scale change efforts that require approximately 5 years of leadership continuity (Seashore Louis, Leithwood, Wahlstrom, & Anderson, 2010). Additionally, principals in lower SES schools tend to have a greater impact on student performance than principals at higher SES schools (Leithwood, Seashore Louis, Anderson, & Wahlstrom, 2004; Seashore Louis et al., 2010). Given the importance of this issue, tracking principal turnover in the context of a school's SES is valuable in identifying trends, ascertaining where turnover is the greatest, and providing a baseline metric for change efforts.
See further discussion below.

FRLP: Free or reduced lunch program

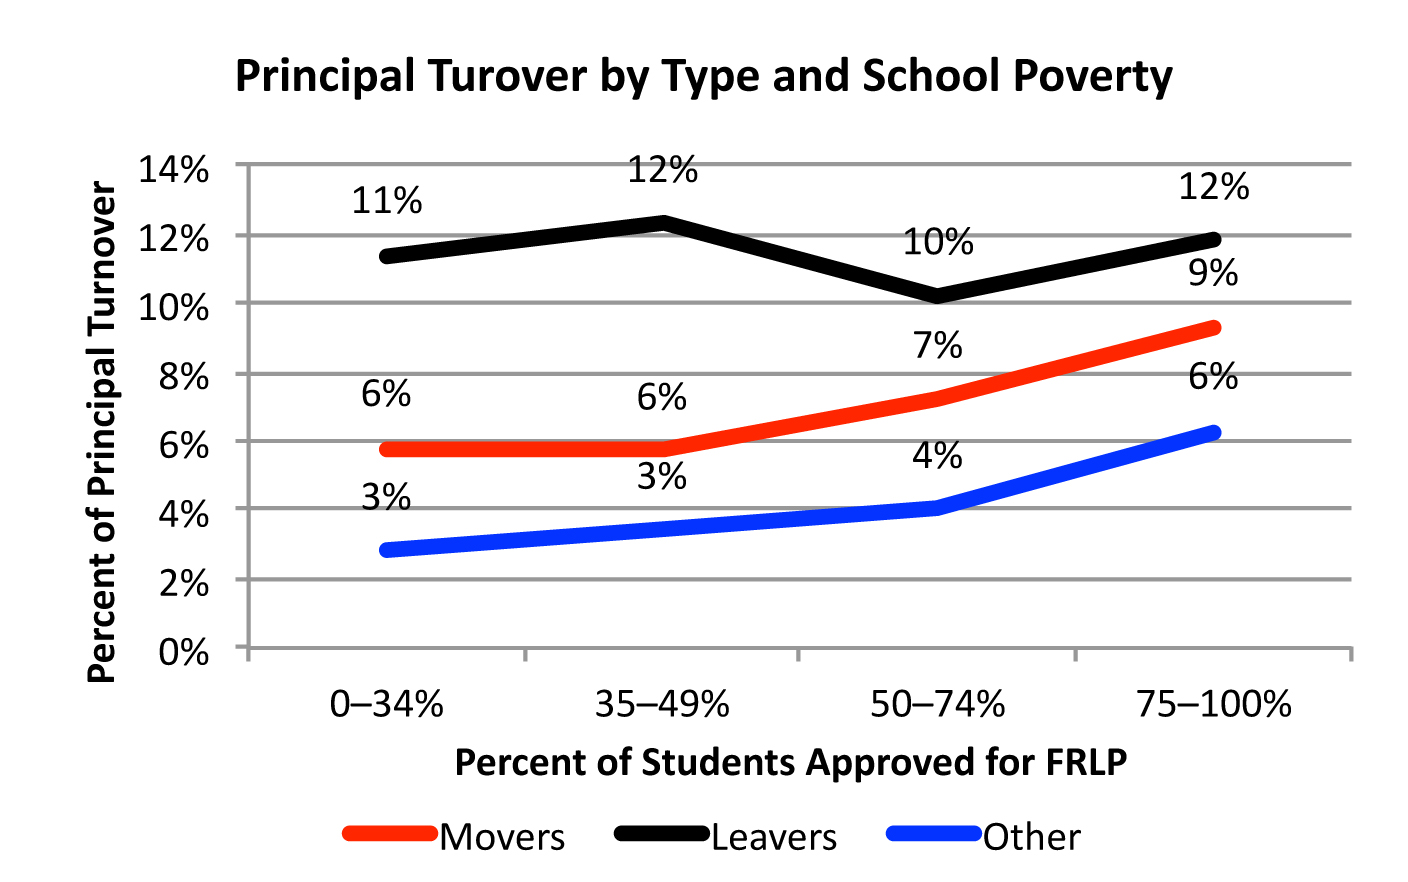
Movers: Principals who moved to a different school
Leavers: Principals who left the profession
Other: Principals who left their current schools, but where they went is unknown


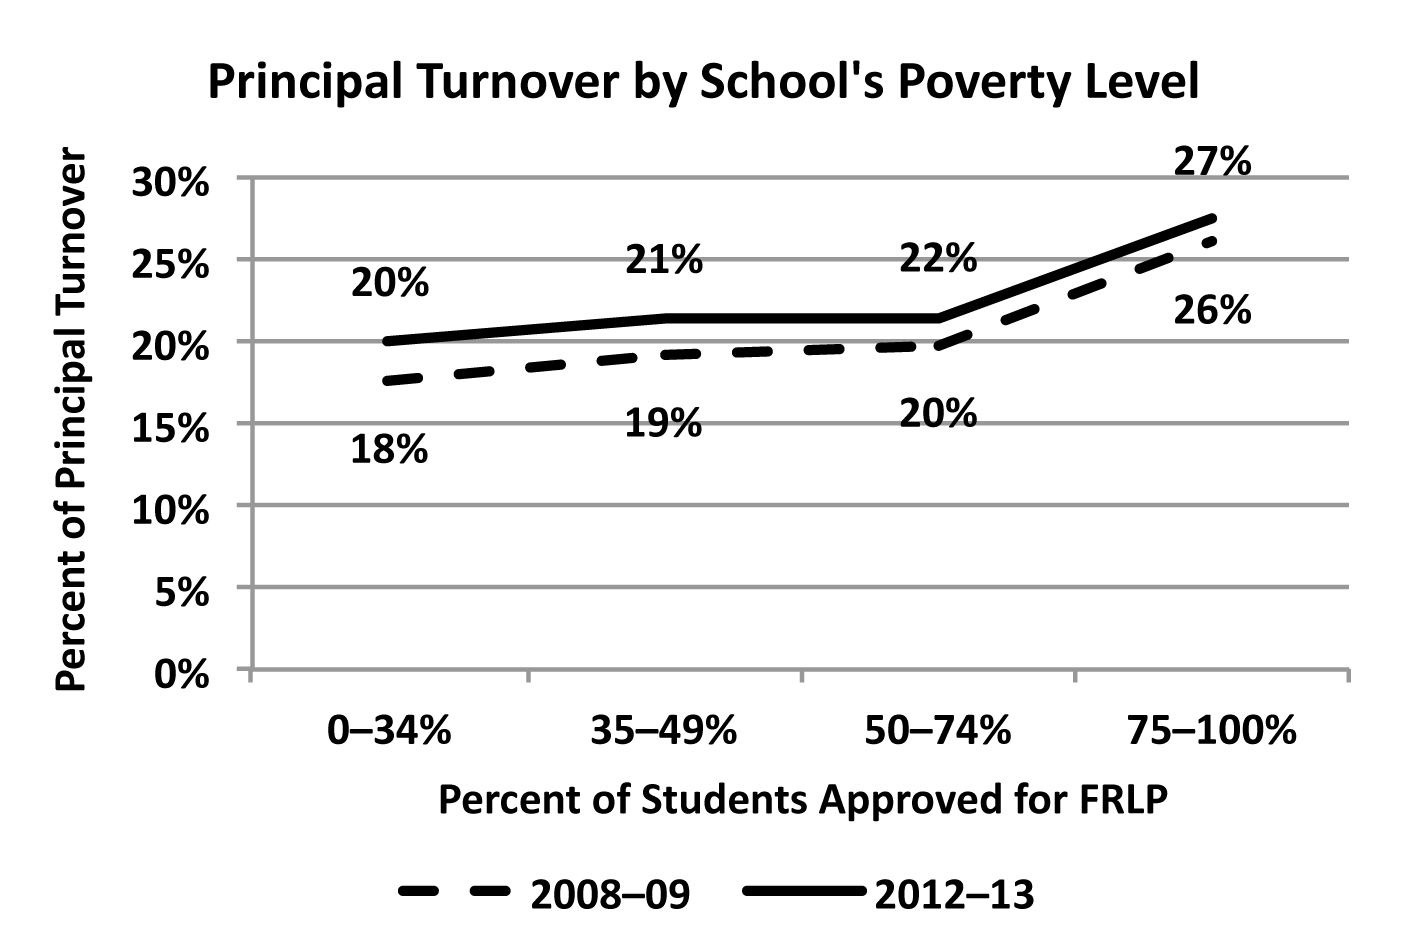
Results: In the 2012–13 school year, principal turnover increased as a school's percentage of students qualifying for FRLP increased. Schools with 75% to 100% qualifying students experienced a 27.4% turnover of school principals versus a 20% turnover for schools with 0% to 34% qualifying students.
Most of the turnover was the result of principals changing jobs. The principals who moved to another school ("movers") showed a consistent relationship with a school's SES. The higher the percentage of students who qualified for FRLP, the higher the percentage of principals moving. The principals who left the profession ("leavers") seemed to be unrelated to the school's SES demographics.
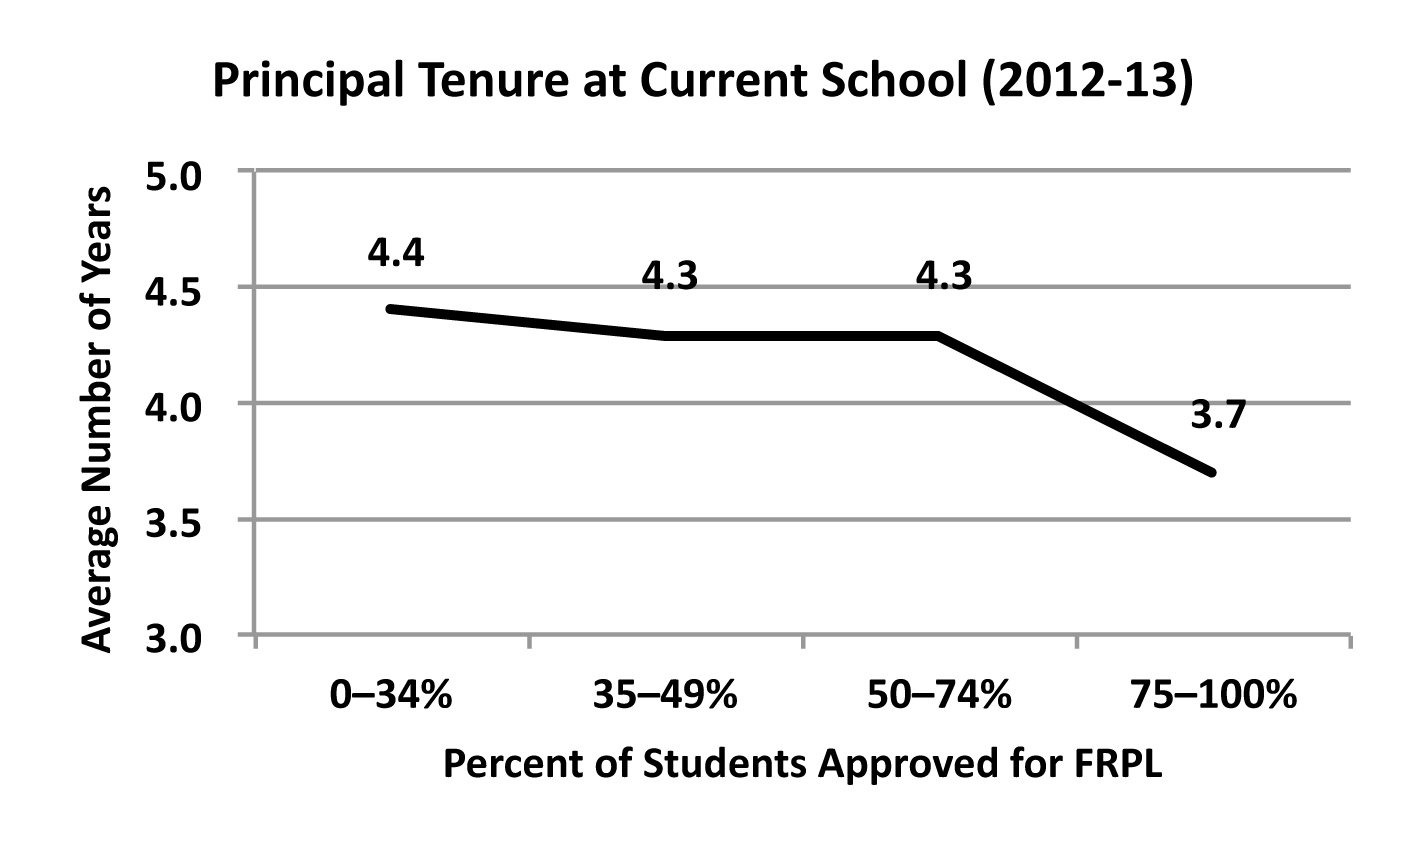
The average tenure of school principals at their current schools, also for the 2012–13 school year, was similarly influenced by the percentage of students qualifying for FRPL. It ranged from 4.4 years in high SES schools to 3.7 years in low SES schools.
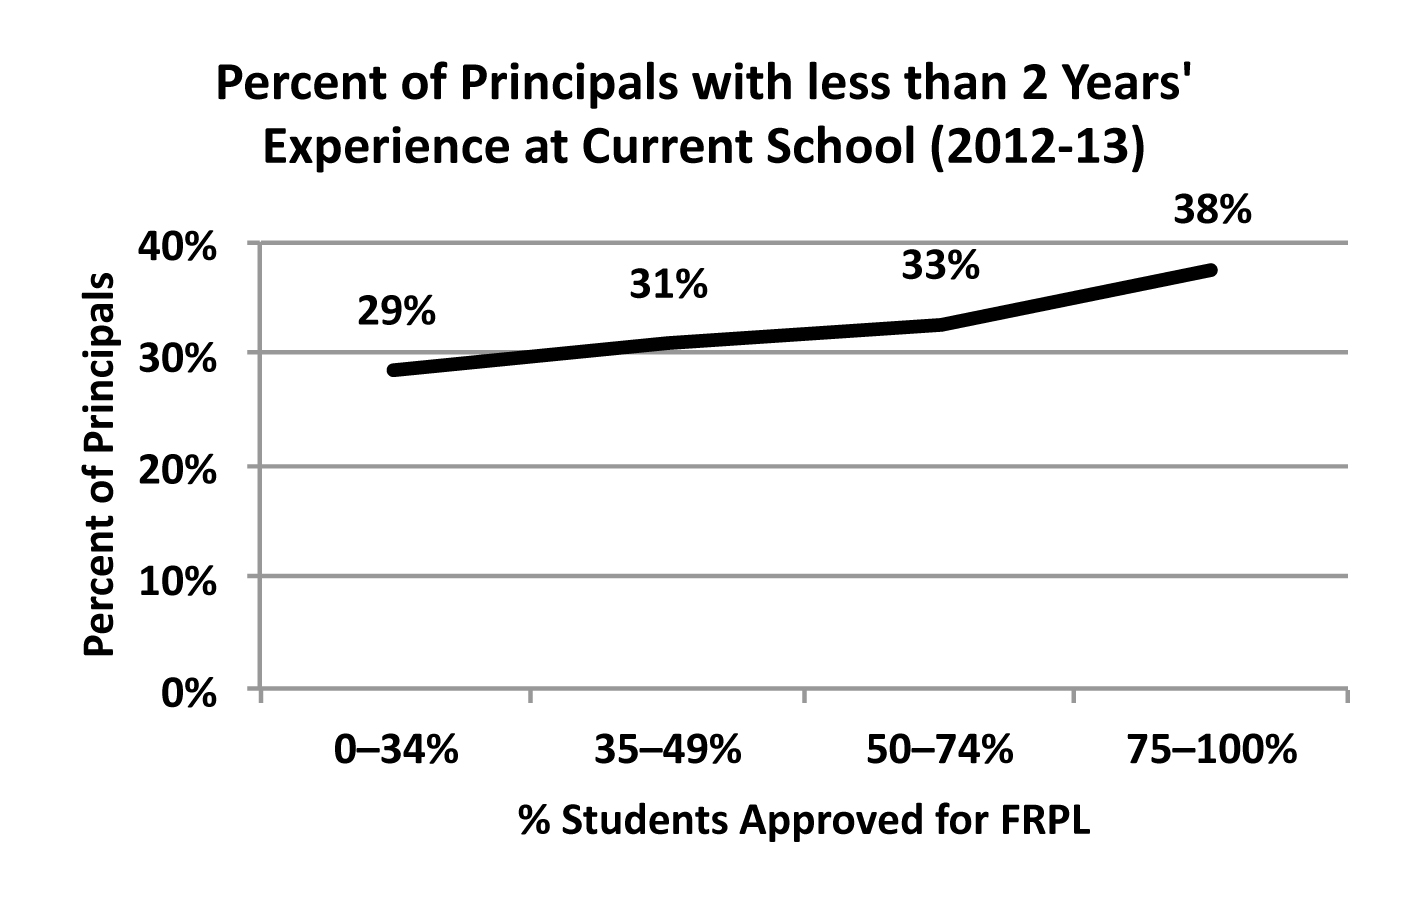
The percentage of schools with new principals (less than 2 years' experience at their current school) in 2012–13 was directly related to a school's SES. Among schools with the highest percentage of students qualifying for FRLP, 37.6% had principals who had been there for 2 years or less. Only 28.5% of schools with the lowest percentage of FRLP students were led by principals who had been at their current schools for 2 years or less.
Overall turnover increased only slightly from the 2008–09 school year to the 2012–13 school year, and the tendency of turnover to increase with lower SES schools remained consistent.
Implications: Schools with lower SES students are often the lowest performing schools overall. There is a great need for consistent, effective school leadership to turn such schools around. The data suggest that the current system for selection, development, and support of school principals is failing these schools. Changes to the system are imperative when the principal turnover rate and duration of time at a given school are directly related to the percentage of students qualifying for FRLP.
Study Description: The 2012–13 Principal Follow-up Survey (PFS) is a component of the Schools and Staffing Survey (SASS), a nationally representative sample survey of public and private K–12 schools, principals, and teachers in the 50 states and District of Columbia. The purpose of the SASS is to collect information that can provide a detailed picture of U.S. elementary and secondary schools and their staff. It was developed by the National Center for Education Statistics (NCES) of the Institute of Education Sciences within the U.S. Department of Education and was conducted by the U.S. Census Bureau.
The SASS covers a wide range of topics including teacher demand, teacher and principal characteristics, general conditions in schools, principals' and teachers' perceptions of school climate and problems in their schools, teacher compensation, district hiring and retention practices, and basic characteristics of the student population.
Citation:
Battle, D. (2010). Principal attrition and mobility: Results From the 2008–09 Principal Follow-up Survey (NCES 2010-337). U.S. Department of Education, National Center for Education Statistics. Washington, DC: U.S. Government Printing Office.
Béteille, T., Kalogrides, D., & Loeb, S. (2012). Stepping stones: Principal career paths and school outcomes. Social Science Research, 41(4), 904–919.
Bitterman, A., Gray, L., & Goldring, R. (2013). Characteristics of public and private elementary and secondary schools in the United States: Results from the 2011–12 Schools and Staffing Survey (NCES 2013–312). U.S. Department of Education. Washington, DC: National Center for Education Statistics.
Burkhauser, S., Gates, S. M., Hamilton, L. S., & Ikemoto, G. S. (2012). First-year principals in urban school districts: How actions and working conditions relate to outcomes. Washington, DC: Rand Corporation.
* Goldring, R., & Taie, S. (2014). Principal attrition and mobility: Results from the 2012–13 principal follow-up survey (NCES 2014-064). U.S. Department of Education. Washington, DC: National Center for Education Statistics.
Leithwood, K., Seashore Louis, K., Anderson, S., & Wahlstrom, K. (2004). Review of research: How leadership influences student learning. New York, NY: The Wallace Foundation.
Marzano, R. J., Waters, T., & McNulty, B. A. (2005). School leadership that works: From research to results. Alexandria, VA: Association for Supervision and Curriculum Development.
Robinson, V. M. J., Lloyd, C. A., & Rowe, K. J. (2008). The impact of leadership on student outcomes: An analysis of the differential effects of leadership types. Educational Administration Quarterly, 44(5), 635–674.
Seashore Louis, K., Leithwood, K., Wahlstrom, K. L., & Anderson, S. E. (2010). Investigating the links to improved student learning: Final report of research findings. New York, NY: The Wallace Foundation.
*study from which graph data were derived
