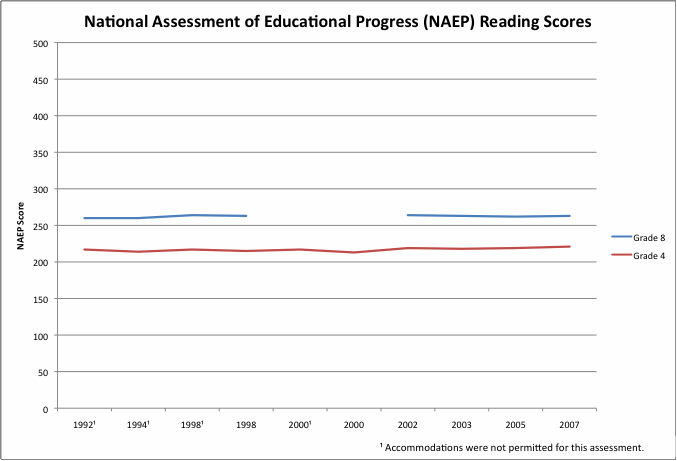
How have American students been performing in reading over the past 20 years?
Why is this question important? Proficiency in reading occupies center stage as the single most critical skill taught in schools. Success in reading is a strong predictor of a student's future success. As such, reading is core to measuring the effectiveness of the American education system. Tracking student performance over time in reading acts both a gauge of the overall success in the nation’s schools success in teaching core curricula as well judging the effects of reform efforts.
See further discussion below.

Source: American National NAEP Reading Scores 1990 through 2007. U.S. Department of Education, National Center for Education Statistics, National Assessment of Educational Progress (NAEP), from the NAEP Data Explorer (http://nces.ed.gov/nationsreportcard/nde/ ).
Results: The national average reading scores of 4th- and 8th-graders were higher in 2007 than in 1992, by 4 and 3 points, respectively. These 2007 scores were also higher than the 2005 scores, but overall scores have remained flat for the past 18 years. For detailed information, please refer to http://nces.ed.gov/programs/digest/d08/ (table 123).
Implications: Over the past 18 years 4th grade reading scores have improved by only 1.8%. The status of 8th grade scores is even worse with a rise of only 1.2% during these years. The trend is flat and indicates that reform efforts to improve the reading of American students have been unsuccessful, requiring a renewed effort to rethink how we are teaching the core skills of reading.
Authors: IES National Center for Educational Services
Publisher: U.S. Department of Education
Institute of Education Sciences - IES National Center for Educational Services
Study Description: The National Assessment of Educational Progress (NAEP) conducts long-term trend assessments, which provide information on changes in the basic achievement of America’s youth since the early 1970s. They are administered nationally and report student performance at ages 9, 13, and 17 in reading and mathematics. Measuring trends of student achievement or change over time requires the precise replication of past procedures. Therefore, the long-term trend instrument does not evolve based on changes in curricula or in educational practices. The NAEP scores have been evaluated at certain performance levels. Scale ranges from 0 to 500. Students at reading score level 150 are able to follow brief written directions and carry out simple, discrete reading tasks. Students at reading score level 200 are able to understand, combine ideas, and make inferences based on short uncomplicated passages about specific or sequentially related information. Students at reading score level 250 are able to search for specific information, interrelate ideas, and make generalizations about literature, science, and social studies materials. Students at reading score level 300 are able to find, understand, summarize, and explain relatively complicated literary and informational material. Excludes persons not enrolled in school and those who were unable to be tested due to limited proficiency in English or due to a disability.
Please note: For purposes of data display, test results for the years 1992, 1994, 1998, and 2000 did not permit accommodations. These results did not impact the flat trend that has been evident over the period 1992 through 2007 and have been included to show this trend.
Definitions:
National Assessment of Educational Progress (NAEP): “The Nation’s Report Card” is the only ongoing national standardized assessment of reading, math, science, writing, US history, civics, geography, and the arts. The test is administered to random schools in each state to evaluate national performance of students ages 7, 12, 14, and 17.
Related Research: American National NAEP Reading Scores 1990 through 2007
