INDICATOR #1 Current Student Performance: Academics, High School Graduation, Dropouts
Data:
Figure 1.1 NAEP: Percent of students at or above proficiency in reading, math and science (2015)
Table 1.2 PIRLS: Reading scores (4th grade) in comparison with other nations (2011)
Table 1.3 TIMSS: Math scores (4th and 8th grade) in comparison with other nations (2015)
Figure 1.2 High School Graduation Rates (AFGR & ACGR) (2012—2015)
Table 1.4 OECD: U.S. high school graduation rate in comparison with other nations (2014)
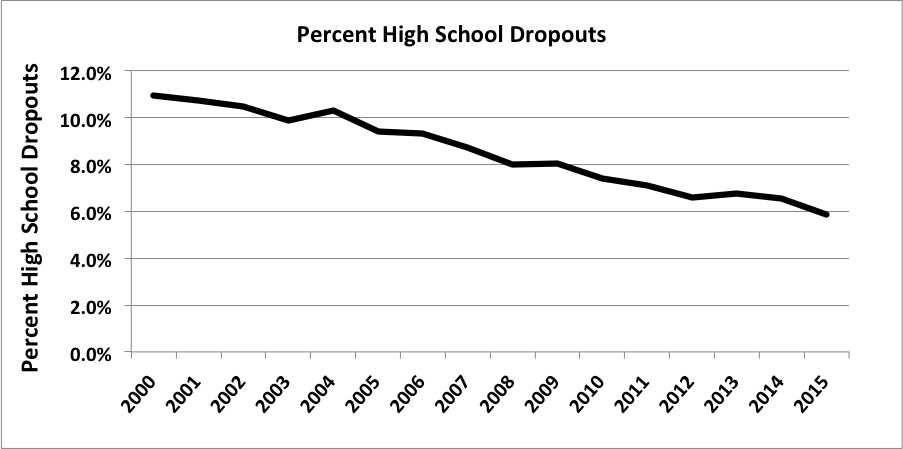
Figure 1.3 High school dropouts (2000—2015)
Definitions and Background
Measuring Student Performance at the Macro Level
The National Assessment of Educational Progress (NAEP)
The Program for International Student Assessment (PISA)
The Progress in International Reading Literacy Study (PIRLS)
The Trends in International Mathematics and Science Study (TIMSS):
Averaged Freshman Graduation Rate (AFGR)
Adjusted Cohort Graduation Rate (ACGR
Organisation for Economic Co-operation and Development (OECD)
NCES Digest of Education Statistics
Figure 1.1 NAEP: Percent of students at or above proficiency in reading, math and science (2015)
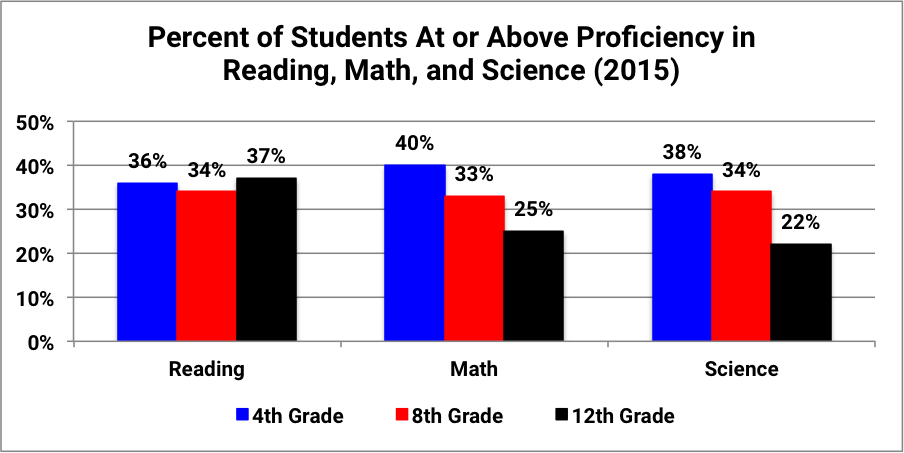
The data shows that two thirds of students are below proficiency in reading at all three grade levels. This is trend consistent with the research that tells us children who fall significantly behind in reading at an early age have a very small chance of making up the difference. The proficiency scores for math and science are equally distressing as the significant majority of students are not at proficiency. However the math and science trend data across grades is more alarming as it shows fewer and fewer students at proficiency as they progress through the grades.
click to go back to the table of contents
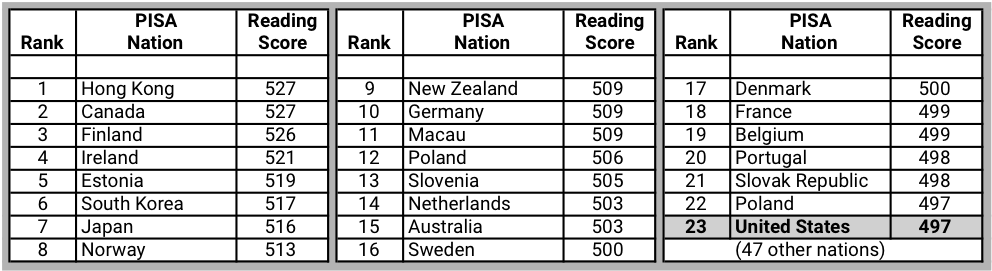
Table 1.1 PISA: Reading, math, and science scores in comparison with other nations (2015)
Reading
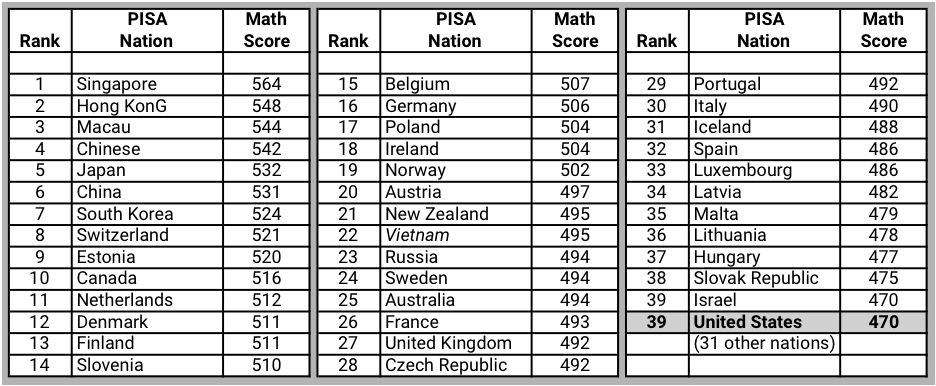
Math
Science

One of the key ways in which PISA data can be used to benchmark student (fifteen year olds) performance is by comparing U.S. scores against 70 other OECD member and participating nations.
In the 2015 PISA assessment, the United States ranked 23rd among participating nations in reading, 39th in mathematics, and 25th in science.
click to go back to the table of contents
Table 1.2 PIRLS: Reading scores (4th grade) in comparison with other nations (2015)
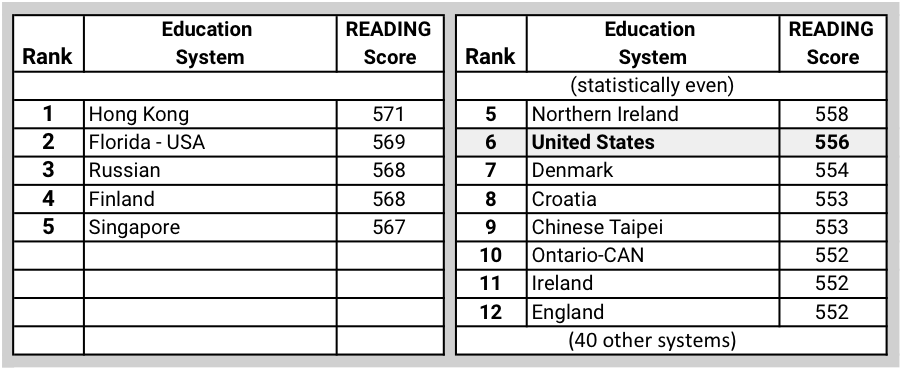
The PIRLS assessment data benchmarks student (4th graders) reading performance against 53 other international education systems (nations, subnational entities).
In the 2011 PIRLS assessment, the United States was among the top 13 educational systems in reading scores. Five nations performed better and the next eight had statistically equal scores.
click to go back to the table of contents
Table 1.3 TIMSS: Math scores (4th and 8th grade) in comparison with other nations (2015)
4th grade
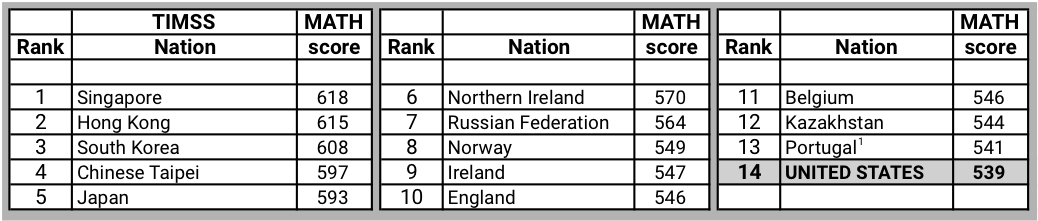
8th grade
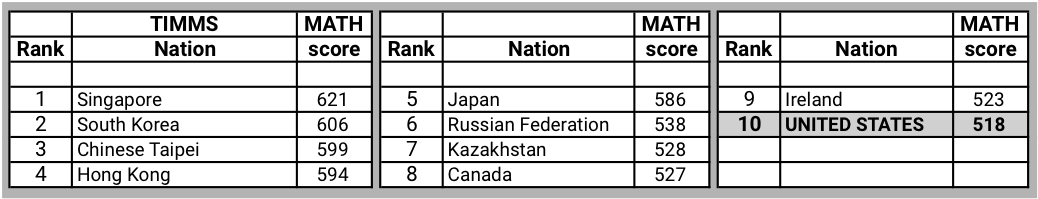
Figure 1.2 High School Graduation Rates (AFGR & ACGR) (2012—2015)
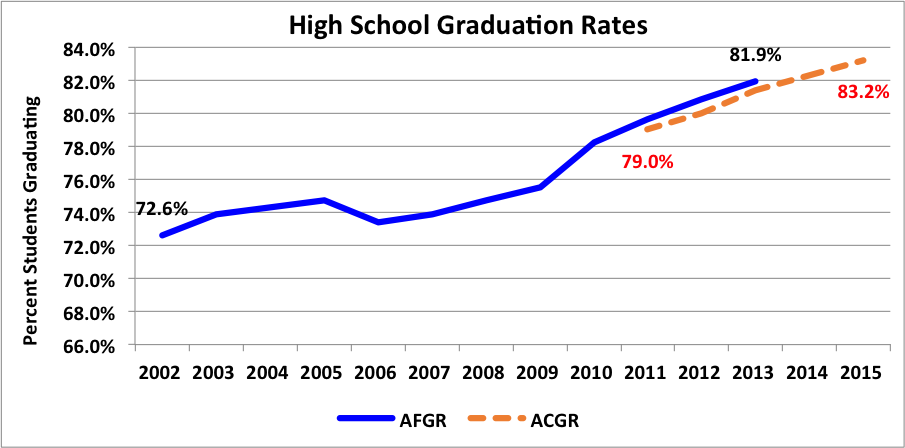
Table 1.4 OECD: U.S. high school graduation rate in comparison with other nations (2014)
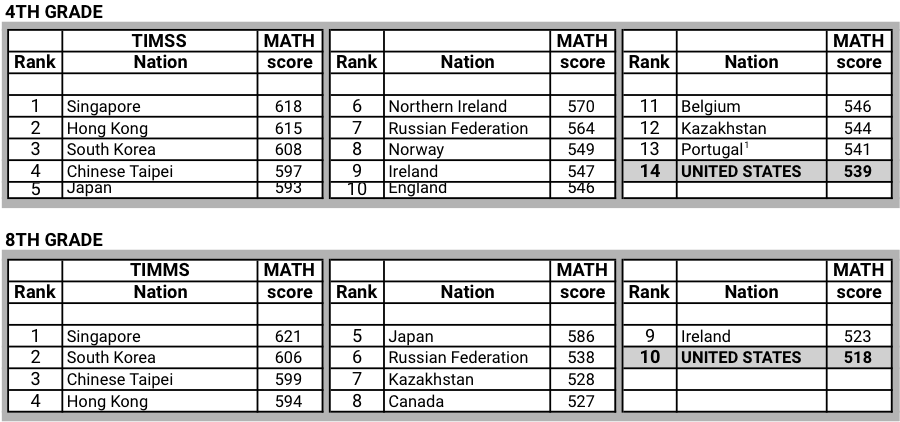
Figure 1.3 High school dropouts (2000—2015)
(note….I will clean up and shorten the folowing descriptions….
Measuring Student Performance at the Macro Level
The value of a nation’s education system is measured by how well it serves all of its children, not just those fortunate enough to attend a model school or live in a high-performing school district.
An effective education system requires meaningful and accurate feedback data for evaluating education performance at both a micro level (individual student and staff performance) and a macro level (system performance at different units of scale, i.e., school, district, state, and nation). This chapter examines our performance at the macro level. There exists a wealth of macro data on the education system’s overall performance across time that sheds light on our performance in the areas of participation, quality, equity, and efficiency. We just haven’t been using it to drive policy decisions.
A key element of benchmarking is the identification of critical performance indicators. Without such indicators, it is impossible to evaluate the effectiveness of our education system or make sound decisions about school reform initiatives. Indicators need to be reliable (repeated measures of the same event yield the same score), valid (they measure what we think they are measuring), and socially relevant (the outcomes reflect society’s values). To make matters more challenging, both process measures and outcome measures are needed. Without process measures (treatment integrity) to tell us if education interventions are being implemented as designed, it is virtually impossible to draw conclusions. And, finally, outcome measures need to be collected on the performance of all aspects of the education system: students, staff, and organizations.
Benchmarking Macro Educational Performance Outcomes
Benchmarking education performance at the macro level has its limitations. The scale of measurement is large. The indicators often reflect the aggregation of data from multitudinous units of performance. Drawing conclusions about specific causal relations becomes very challenging as the data may consist of performance averages, include the cumulative impact of numerous interventions, and reflect snapshots in time (e.g., annual data). And given the scale of the analysis, changes in performance often move slowly, not unlike a large ocean-going vessel changing course. However, macro indicators represent critical performance outcomes, as ultimately an education system must be measured by the overall sum of its parts. It does matter how all the students are performing, especially when equity is important. And while there are limitations to which conclusions can be drawn, this chapter presents an overwhelming preponderance of evidence showing an education system in crisis. By virtually every macro indicator, we are failing the goals of high participation, high quality, high equity, and high efficiency.
There is an increasing amount of macro-level data being generated that that can be used to benchmark an education system’s critical performance outcomes. As the balance of this chapter will reference these resources, it is worth taking some time to discuss their relative strengths and weaknesses.
Education stakeholders are in a constant debate about what constitutes a quality education and how best to measure student outcomes. In particular, there is significant disagreement about the use and value of high-stakes standardized tests. Both their validity (what they measure) and reliability (how well they measure) are often disputed when applied at the micro-level (evaluating individual students or teachers). Despite these questions, standardized tests provide extremely valuable student performance measures at the macro level over time. They may not measure every desired education achievement, but they can assess one of the system’s most important outcomes: what students have learned in selected content areas (e.g., reading, math). And while some of the standardized tests used in different states and localities may merit criticism from validity and reliability perspectives, there are national and international standardized tests that meet the highest standards of reliability, validity, and social relevance. Data from these tests provide a clear and unambiguous picture of how well the U.S. education system is educating students on selected measures. These national and international tests include the following:
The National Assessment of Educational Progress (NAEP)
NAEP has often been called the gold standard for standardized academic testing because of its constant rigorous scrutiny. (cit. 2) Established in 1964, with the first tests administered in 1969, NAEP provides a continuing assessment of what American students know and can do in math, reading, science, writing, the arts, civics, economics, geography, and U.S. history. NAEP is administered by the National Center for Education Statistics (NCES), a division of the Institute of Education Sciences in the U.S. Department of Education. Panels of technical experts within NCES and other organizations continually scrutinize tests for reliability and validity, keeping them similar from year to year and documenting changes. It is one of the only common metrics for all states, providing a picture of student academic progress over time.
The Program for International Student Assessment (PISA)
PISA is a carefully constructed and well-documented test instrument for measuring student academic performance across nations. Coordinated by the Organisation for Economic Co-operation and Development (OECD), this international study has been conducted every 3 years since 2000. In 2015 it measured the performance of 15-year-old students in 70 countries and education systems (35 member nations and 35 participating nations) in reading, mathematics, and science. In addition to reporting on test scores, PISA collects data on a large number of education system characteristics and identifies statistical correlations between results and selected variables.
The Progress in International Reading Literacy Study (PIRLS)
PIRLS is an international comparative assessment that measures student learning in reading. Since 2001, PIRLS has been administered every 5 years. PIRLS documents worldwide trends in the reading knowledge of 4th-graders as well as school and teacher practices related to instruction. Fourth-grade students complete a reading assessment and questionnaire that addresses students' attitudes towards reading and their reading habits. In addition, questionnaires are given to students' teachers and school principals to gather information about students' school experiences in developing reading literacy. The first administration of PIRLS in 2001 included 36 education systems (including countries and subnational entities, such as Canadian provinces and Hong Kong, a Special Administrative Region of the People’s Republic of China). It was followed five years later by the second administration in 2006 which included students in 45 education systems. The 2011 administration of PIRLS included 53 education systems participating at grade 4. For the fourth administration in 2016, 54 education systems, including the United States will take part in the 2016 PIRLS cycle. For the first time PIRLS will also include an innovative assessment of online reading called ePIRLS.
Participating in PIRLS allows for a greater understanding of how the reading knowledge and skills of U.S. 4th-graders compare with 4th-graders from other countries. PIRLS informs national discussions about education policy as well as international competitiveness. PIRLS is coordinated by the International Association for the Evaluation of Educational Achievement (IEA). More information can be found in the PIRLS brochure.
The Trends in International Mathematics and Science Study (TIMSS):
TIMSS provides reliable and timely data on the mathematics and science achievement of U.S. students compared to that of students in other countries. TIMSS data have been collected from students at grades 4 and 8 since 1995 every 4 years, generally. In addition, TIMSS Advanced measures advanced mathematics and physics achievement in the final year of secondary school across countries. TIMSS Advanced data have been collected internationally three times, in 1995, 2008 and 2015. The United States participated in TIMSS Advanced in 1995 and 2015. TIMSS is sponsored by the International Association for the Evaluation of Educational Achievement (IEA) and managed in the United States by the National Center for Education Statistics (NCES), part of the U.S. Department of Education.
The most recent TIMSS data collection was in 2015 and included students in grades 4, 8 and 12. Click for further information about TIMSS 2015 and TIMSS Advanced 2015. In TIMSS 2015, more than 60 countries and other education systems, including the United States, participated in TIMSS at grades 4 and 8, and 9 participated in TIMSS Advanced. Results from the 2015 TIMSS and TIMSS Advanced were released on November 29th, and can be viewed on the Results page.
Averaged Freshman Graduation Rate (AFGR)
Average Freshman Graduation Rate (AFGR): Prior to implementation of the Adjusted Cohort Graduation Rate, the NCES developed a model for estimating graduation rates using enrollment data that accounted for students who were enrolled in the ninth grade but did not finish school. Based on a technical review and analysis, the AFGR was selected as the most accurate indicator from a number of alternative estimates that can be calculated using available cross-sectional data.
Adjusted Cohort Graduation Rate (ACGR
Four-year Adjusted Cohort Graduation Rate (Cohort Graduation Rate): The 4-year adjusted cohort graduation rate is the number of students who graduate in 4 years with a regular high school diploma divided by the number of students who entered high school 4 years earlier. It was adopted in 2008, when the U.S. Department of Education enacted regulations establishing a uniform and more accurate measure for calculating the rate at which students graduated from high school. Starting in the 2010–11 school year, the 4-year adjusted cohort graduation rate captures all students, including those who drop out in earlier grades. Above all, it is a metric that is uniform across all 50 states and can be used over time.
Organisation for Economic Co-operation and Development (OECD)
NCES Digest of Education Statistics