Student Absence vs. Reading Scores
What is the academic performance impact of student absence?
Why is this question important? Parents and students have a wide range of reasons for students to miss class, from doctor and dentist appointments to family vacations. This data shows the potential impact of absence on student performance.
See further discussion below.
Source: National Assessment of Educational Progress Data Explorer
http://nces.ed.gov/nationsreportcard/naepdata/dataset.aspx
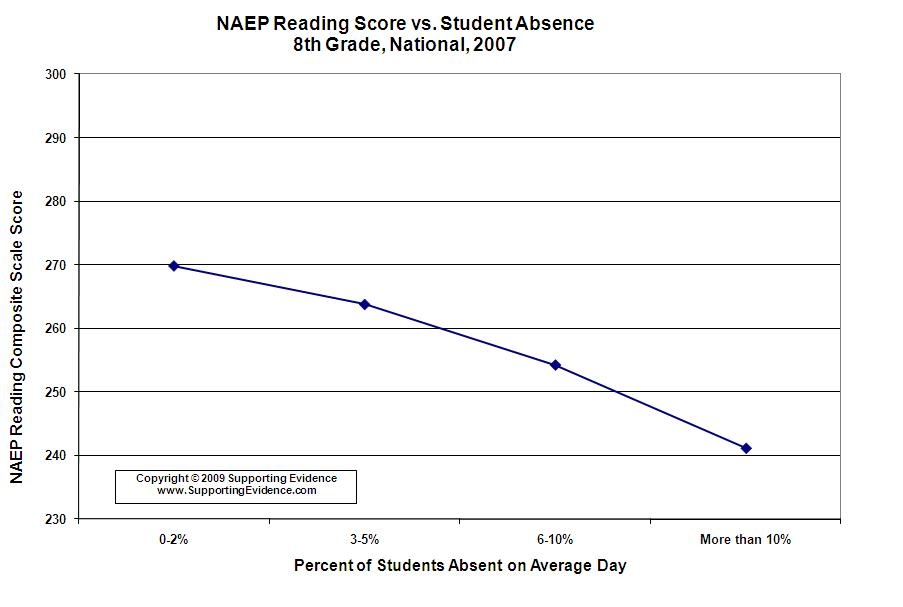
Results: Strong correlation between NAEP Reading score and student absence. As one would expect, the more students are absent from class, the worse their reading scores. Scores of students absent more than 10% are nearly 11% below scores of students absent between 0 and 2%.
Implications: This data supports the relationship between students missing class and worse academic performance.
Authors: National Assessment of Educational Progress, Institute of Education Sciences, National Center for Education Statistics, U.S. Department of Education
Publisher: National Assessment of Educational Progress, Institute of Education Sciences, National Center for Education Statistics, U.S. Department of Education
Study Description: The NAEP Reading Test for Grade 8 evaluates three contexts for reading: reading for information, reading for literary experience, and reading to perform a task - and four reading aspects: general understanding, developing interpretation, making reader/text connections, and examining content and structure.
http://nces.ed.gov/nationsreportcard/reading/whatmeasure.asp
As part of the NAEP assessment, student questionnaires collect information on students' demographic characteristics, classroom experiences, and educational support. Teacher questionnaires gather data on teacher background, training, and instructional practices (for grades 4 and 8). School questionnaires, completed by principals or assistant principals, gather information on school policies and characteristics. Questionnaires for Students with disabilities or English language learners (SD/ELL), completed by special education or English language teachers, collect information about students who have disabilities or limited English proficiency.
Results from the long term reading assessment were grouped based on how schools answered the background question, 'About what percentage of your students is absent on an average day? (Include excused and unexcused absences in calculating this rate.)
Possible answers were: 0-2%, 3-5%, 6-10%, More than 10%.
Definitions:
NAEP = National Assessment of Educational Progress
NCES = National Center for Education Statistics
National Assessment of Educational Progress Data Explorer Variables:
Subject: Reading
Measure: Composite scale
Grade: Grade 8
Jurisdiction: National
Year: 2007
School Factors|School climate|Percent absent on average day(school-reported)