Chronic Student Absenteeism: A Significant and Overlooked Obstacle to Student Achievement
(Wing Institute Original paper)
Chronic Student Absenteeism PDF
Keyworth, R., Detrich, R. & States, J. (2019). Overview of Chronic Student Absenteeism: A Significant and Overlooked Obstacle to Student Achievement. Oakland, CA: The Wing Institute. https://www.winginstitute.org/perform-levels-student.
Table of Contents
It simply doesn’t matter how good a teacher, curriculum, or school is if a student is not in regular attendance. Decades of research document the significant negative impacts of student absenteeism on academic achievement, emotional development, graduation, health, and long-term success (Gottfried, 2015). Yet, until just a few years ago, the U.S. K–12 education system was virtually unaware that it had a chronic student absenteeism problem. Prior to that time, chronic absenteeism was never tracked by school systems, let alone addressed. A recent analysis of the data revealed that a significant number of students (one in seven) were chronically absent, defined as missing 10% of school days (Balfanz & Brynes, 2012). And that was the threshold number. Many students identified as chronically absent missed more than 10%. The corresponding negative impacts worsen with every additional day of school missed.
The bad news is that chronic absenteeism is a pervasive and complicated problem that requires a significant, systematic, inclusive, ongoing data-driven model involving all aspects of schools, families, and the community. The good news is that there is now an increased focus on this issue at all levels of education (federal, state, and local). It is one of those rare opportunities to have a meaningful impact on student success through interventions that are straightforward, non-ideological, cost-effective, and achievable.
This overview looks at the best available evidence on chronic student absenteeism in the context of (1) the scale of the problem at all levels of the education system: national, state, school, and grade; (2) the impact on student academic performance, graduation, health, and financial impact on school districts; (3) impact multipliers that exacerbate chronic absenteeism, such as poverty, student mobility, homelessness, and disciplinary suspensions; and (4) interventions utilizing a public health tiered model for different levels of action depending on need, a performance feedback system to track and modify the results of each intervention, and coordination of resources across a wide range of education stakeholders.
Despite a solid and compelling body of research on student absenteeism, there is still much quantitative research to be completed. This overview examines the best available evidence from a wide range of descriptive and correlational analyses executed by various state and city education departments, research groups, and academic researchers. Fortunately, the data paint an unequivocal picture. The results are overwhelmingly consistent across levels of analysis (school, students), units of measurement (achievement tests, graduation rates, dropout rates), areas of focus (reading, math, social indicators), units of education (grades, schools), and students of all demographics. Additionally, each analysis shows a linear relationship between absences and performance; the greater the number of absences, the worse the performance.
SCALE
One of the first questions worth a discussion is: how did a problem of this magnitude slip through the cracks? The answer lies in several assumptions that turned out to be inaccurate: (1) students will attend school because of cultural norms and compulsory attendance laws (Balfanz, Herzog, & MacIver 2007), (2) excused absences are less harmful than unexcused absences, and (3) existing attendance tracking systems—daily attendance, average daily attendance, truancy monitoring—are adequate for tracking individual student absences to identify chronic student absenteeism.
As it turns out, all of these assumptions are wrong. Regarding the first assumption, most students do indeed attend school, but the percentage of students who are chronically absent is surprisingly and unacceptably high. As for the second assumption, research tells us that there are negative impacts from any and all school days missed, whether they are excused or unexcused. (Gottfried, 2010). The reasons for a child’s absence are certainly important in designing and implementing effective intervention strategies, but the definition of “chronic student absenteeism” includes all types of absences.
With respect to the final assumption, it doesn’t matter how much data is collected if they are not the right data. Schools have always taken student attendance. In fact, school funding is often tied to average daily attendance (ADA), which counts the number of students who show up at school each day. However, these data do not track individual students, nor do they systematically identify, analyze, or address the growing problem of chronic absenteeism. In fact, a school could average 90% ADA and still have as many as 40% of its students chronically absent because different students who are in school on different days make up this average percentage (Balfanz & Brynes, 2012; Henderson, Hill, & Norton, 2014).
Although truancy data track individual students’ attendance, they measure only the pattern and frequency of unexcused absences and not excused absences. School systems typically intervene only when there is a serious truancy issue. Hence, as with ADA, truancy data was not designed to track total absenteeism.
NATIONAL DATA
The student absence threshold defining chronic absenteeism varies somewhat. Leading researchers define it as missing 10% of school days (roughly 18 days) (Balfanz & Brynes, 2012). The U.S. Department of Education defines it as 3 weeks (15 days) (Office of Civil Rights, 2016). Either way, it is a significant loss of school time.
The U.S. Department of Education Civil Rights Data Collection (CRDC) recently started reporting on the number of students who missed more than 3 weeks of school in a school year:
• In the 2013–2014 school year, 6.8 million students met this criteria (13% of the K–12 student population) (Bauer, Liu, Whitmore Schanzenbach, & Shambaugh, 2018).
• In 2015–2016, the number of chronically absent students rose to 7.3 million, an increase of 500,000 (7.4%). This represents 16% of the total student population, or approximately one in seven students (Bauer et al., 2018).
While some of the growth between reporting periods may be the result of improved reporting accuracy, the numbers are still staggering.
To establish some context, a study tracked the absenteeism of a first grade cohort over 5 years (Balfanz, Durham, & Plank, 2008). The data were analyzed by quintiles to calculate total school days missed (see Table 1).
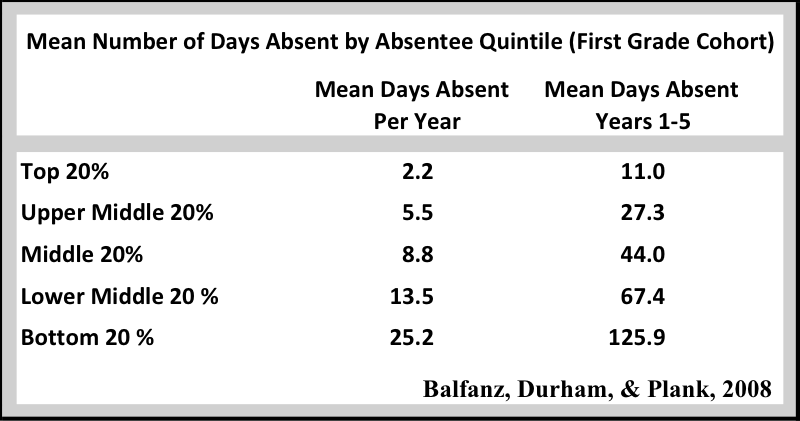
Table 1. Mean number of days absent by absentee quintile (first grade cohort)
Students in the bottom 20% quintile missed more than 25.2 days each year, adding up to 125.9 lost school days in first through fifth grades. During this 5-year period, those students missed the equivalent of 70% of one school year!
The equivalent for students based on a 10% chronic absenteeism formula would be 18 days per year and 90 days over the 5-year period. Students at the lowest level of the chronic absenteeism threshold would miss one half of a school year during this period.
These kinds of losses are extremely difficult, if not impossible, to recover from. As will be shown, it doesn’t take long for absences to add up and derail academic performance.
STATE DATA
CRDC also collects data on each state’s chronic student absenteeism. As is often the case with education metrics, there is great disparity among states in performance. Table 2 examines the data of the 10 states with the highest percentages of students who were chronically absent and the 10 states with the lowest percentages in school year 2015–2016.
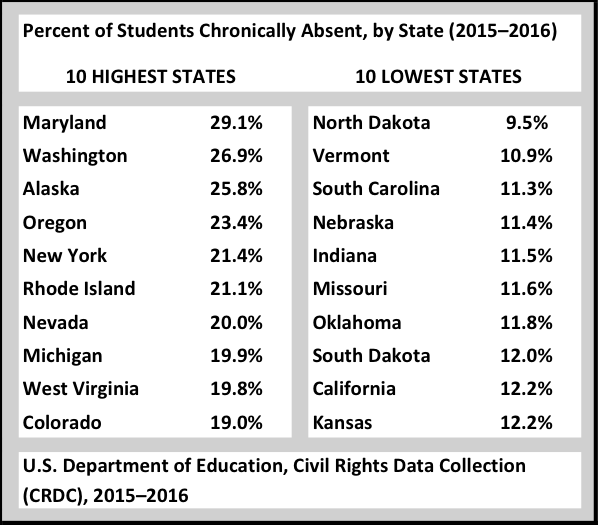
U.S. Department of Education, Civil Rights Data Collection (CRDC), 2015–2016
Table 2. Percent of students chronically absent, by state (2015–2016)
The District of Columba (not shown in Table 2) actually had the highest percentage of students (31%) who missed 15 or more days of school in a year. The state with the highest percentage of absenteeism, Maryland, had 3 times the percentage of chronically absent students as the state with the lowest percentage of absenteeism, North Dakota. The average of the 10 states with the highest absenteeism was nearly twice that of the 10 states with the lowest absenteeism.
The education system is still at the earliest stages of tracking student absenteeism, and each state has its own definition of what does and doesn’t count in this calculation. As a result, it is difficult to draw many conclusions from the data. Maryland is one of the few states that has been tracking and intervening in chronic student absenteeism for years. Its higher percentage of student absences could reflect its more aggressive and systematic tracking system. Conversely, a state with a low percentage could simply not be counting all individual student absences. Regardless, the fact that these data are now available is a starting point that will lead to a more standardized metric. There is a precedent. When high school graduation rates were first published, they included such a range of definitions that comparisons across states were almost useless. Over the years, a common definition was adopted that allowed accurate comparisons (U.S. Department of Education, 2008).
SCHOOL DATA
Chronic student absenteeism varies dramatically from school to school, as it does from state to state. Figure 1 displays a disaggregation of the available data by schools for 2013–2014 and 2015–2016. It examines individual school data by the percent of its students that miss 15 days or more in a year, placing the school in one of five categories of chronic absenteeism: extreme, high, significant, modest, or low. For example a school exhibiting extreme chronic absenteeism has 30% or more of its student population missing 15 days or more of school.

Attendance Works and Everyone Graduates Center, 2017
Figure 1. Chronic absenteeism in schools by percent of enrollment (2013–2014, 2015–2016)
In SY 2015-16, 11,338 schools (12% of all schools) had an extreme chronic absenteeism problem: over 30% of their students missed 15 days or more. Another 12,625 schools (13%) saw between 20% and 29% of their students miss 15 days or more. More than half of all schools (58%) had at least a 10% chronic absenteeism problem in the 2015–2016 school year.
An examination of these 2015–2016 data by total number of students per school revealed an even greater concentration of chronic student absenteeism in some schools. More than half (52%) of chronically absent students were concentrated in one quarter of the schools (Chang, Bauer & Byrnes, 2018).
Chronic absenteeism also can be disaggregated by school grade levels (elementary school, middle school, and high school); see Figure 2.
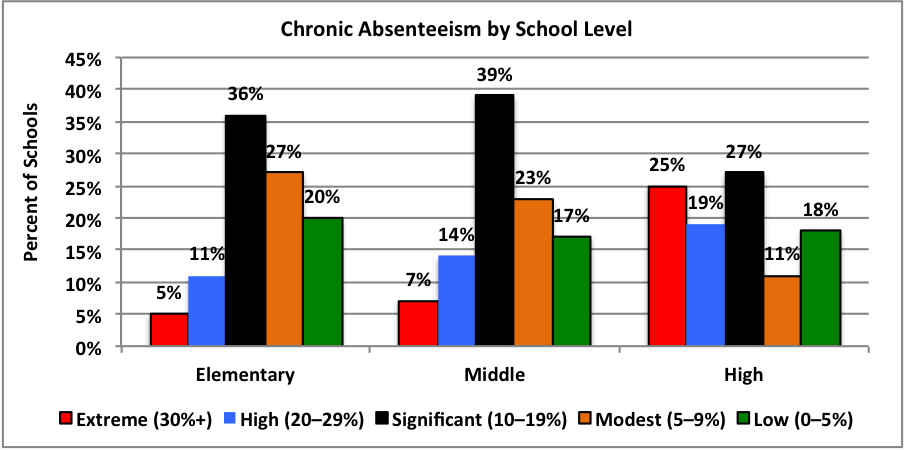
Chang, Bauer & Byrnes, 2018
Figure 2. Nationwide chronic absences by school level (2015–2016)
Chronic student absenteeism rates for individual schools vary significantly depending on school grade levels. In the 2015–2016 school year, 5% of elementary schools, 7% of middle schools, and 25% of high schools had extreme chronic student absenteeism (30% or more of enrollment missed 15 or more days a year). Over 50% of elementary schools, 60% of middle schools and 70% of high schools at least ten percent of their enrollment chronically absent.
GRADE LEVEL DATA
Given the recent awareness by public education of the chronic absenteeism problem, only a few states have data by individual grade levels. While there is variation in the percentages of students at each grade by individual states, the overall data show a consistent pattern of absenteeism. Figure 3 shows the data for Oregon and Utah
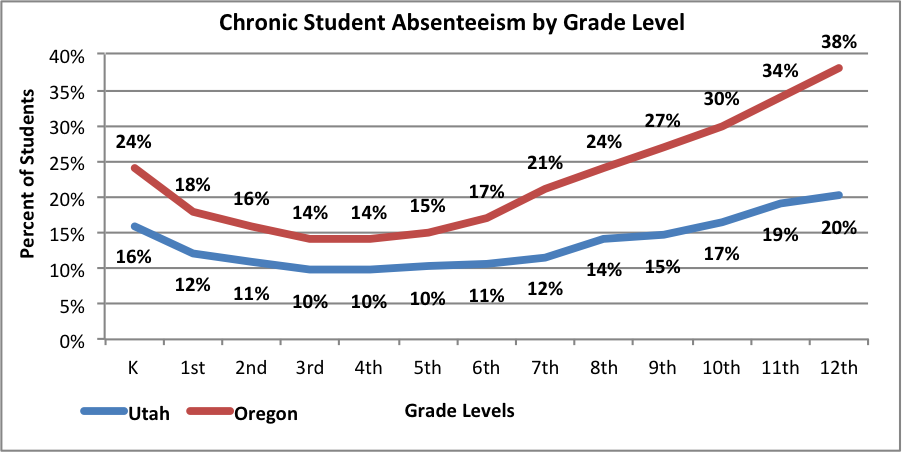
Utah Education Policy Center (2012)
Buehler, M. H., Tapogna, J., Chang, H. N., & ECO Northwest, Ltd. (2012).
Figure 3. Chronic student absenteeism by grade level
As might be expected, the percentage of chronically absent students increases with each year of high school, from ninth grade to twelfth. Thirty-eight percent of Oregon’s twelfth graders were chronically absent, as were 20% of Utah’s twelfth graders. The surprise is that the next grade with the highest percentage was kindergarten, at 24% and 16%. There is a general view that missing kindergarten is not as important as missing other grades (Robinson, Lee, Dearing, & Rogers, 2018). To the contrary, the following section documents the significant and long-lasting negative impact of students missing kindergarten.
IMPACT
There is a significant and growing amount of evidence describing the negative impact that chronic student absenteeism has on student academic achievement, emotional development, dropout rates, graduation, health, and long-term student success. Chronic absenteeism can also negatively affects school district funding. Many large state education agencies only pay districts for days when the student attends school, not days when the student is absent.
The following represents a small sample of the evidence documenting the ramifications of chronic student absenteeism.
ABSENTEEISM PERSISTENCE
It sounds like circular reasoning, but one of the main impacts of chronic student absenteeism is that it leads to more chronic student absenteeism. A history of chronic absenteeism is a significant predictor of future absenteeism (London, Sanchez, & Castrechini, 2016). For example, a student who is chronically absent in kindergarten is 24% more likely to be chronically absent in first grade. A student chronically absent in kindergarten, first grade, and second grade is 41% more likely to be chronically absent in third grade (Bauer et al., 2018).
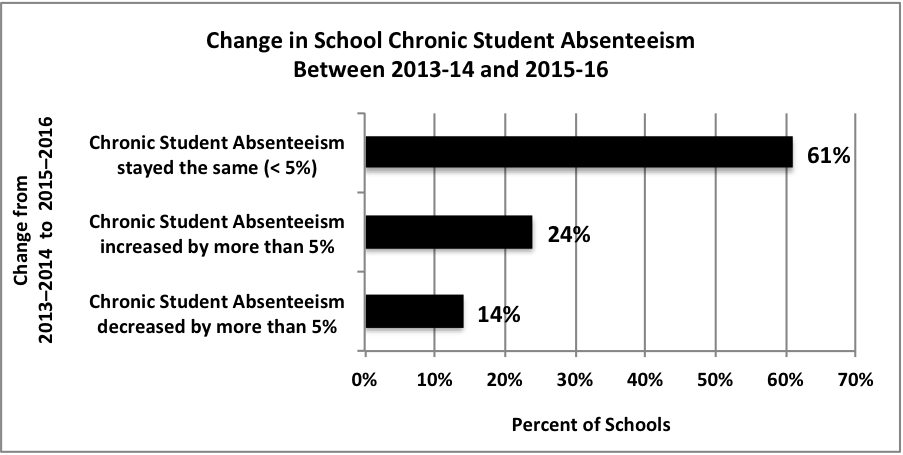
Chronic absenteeism is also persistent at the school level. Data from the 2013–2014 and 2015–2016 CRDC analyses examined whether chronic absenteeism increased, decreased, or remained steady in schools over the 2-year period.
Bauer, L., Liu, P., Whitmore Schanzenbach, D., & Shambaugh, J. (2018).
Figure 4. Change in chronic absenteeism between 2013–2014 and 2015–2016
The data show that chronic absenteeism in 85% of schools either stayed the same or got worse. Only 14% of the schools showed a reduction. An analysis of state data from Maryland also suggests that schools with high rates of chronic absenteeism in one year had the same problem in previous years (Bauer et al., 2018).
Absenteeism persistence also exists at the school calendar level. The Baltimore Education Research Consortium (Olsen, 2014) found that a student’s absenteeism rate in September was a strong predictor of his or her rate for the remainder of the year. Students who missed fewer than 2 days in September continued to average fewer than 2 days each month. Students who missed 2 to 4 days in September were 5 times more likely than those who missed fewer than 2 days to be chronically absent during the year.
Given the persistence of student absence patterns, early intervention to break the cycle is critical.
ACADEMIC PERFORMANCE
The relationship between chronic absenteeism and academic performance is evident at all grade levels, across subjects, and across assessment tools. And the relationship is always linear. Every increase in absenteeism correlates with lower academic performance. The following is a small sample of the many studies across grades that were completed in recent years.
Kindergarten: The negative correlation between high student absenteeism and poor academic performance begins in kindergarten. There is a common belief that missing school at this age doesn’t matter (Robinson, Lee, Dearing, & Rogers, 2018). Often, kindergarten is not even part of state compulsory attendance laws (which typically do not start until children are older) or is offered only half days in many locales. Yet, there is strong correlational evidence suggesting that high absenteeism rates in kindergarten predict negative academic performance in later grades and lower high school graduation rates. These early elementary school years are critical for developing social and academic skills as building blocks for future learning. Disruptions or delays in learning these skills can have a ripple effect on all future learning (Coelho, Fischer, McKnight, Matteson, & Schwartz, 2015).
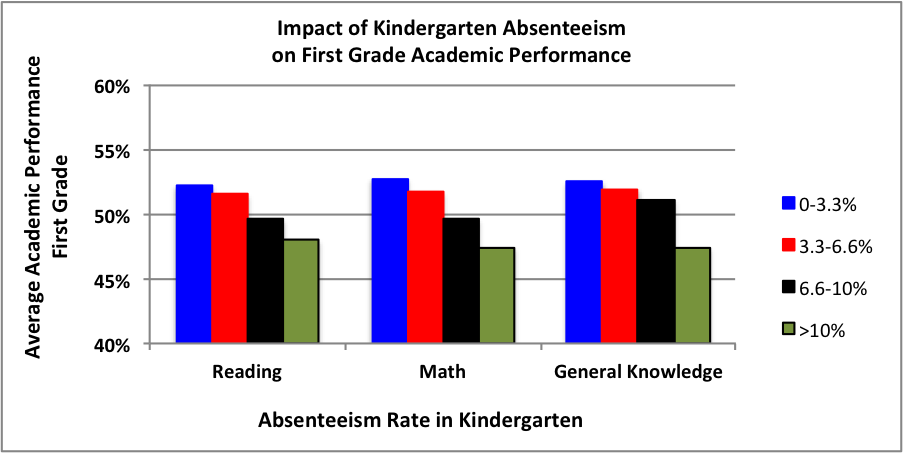
Figure 5 looks at the correlation between absenteeism in kindergarten and academic performance in first grade.
Chang & Romero, 2008
Figure 5. Impact of kindergarten absenteeism on first grade academic performance
Children chronically absent in kindergarten showed lower levels of achievement in math, reading, and general knowledge in first grade. The higher the absenteeism, the lower the performance (Chang & Romero, 2008).
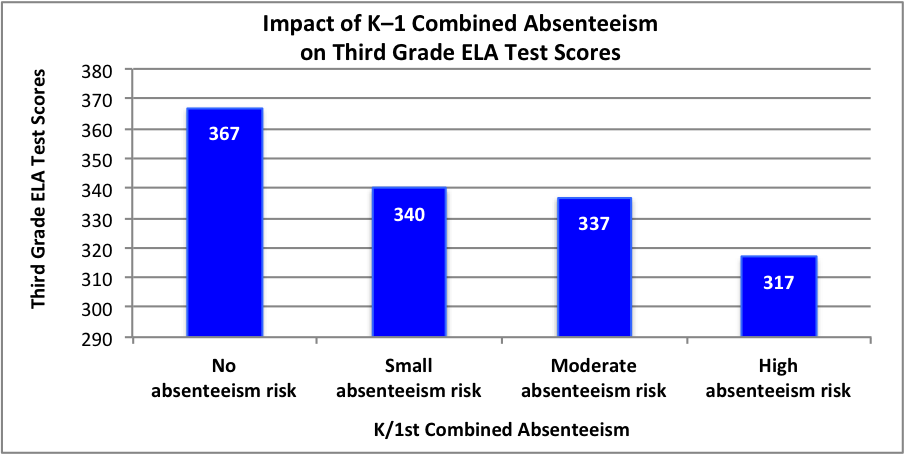
Third Grade: A critical benchmark in early elementary education is reading proficiency in third grade. It is an important pivot point where students shift from learning to read to reading to learn. Interventions for struggling readers after third grade are seldom as effective as those in earlier years (Fiester, 2010). Figure 6 shows the correlation between third grade English Language Arts (ELA) test scores and K–1 combined student absenteeism.
The proficiency score for this exam is 350.
No risk: Both years 0%–4% of days absent
Small risk: Both years 5%–9% of days absent
Moderate risk: One year 5%–9% of days absent; one year 10% of days absent
High risk: Both years with chronic absence (10% or more days absent)
Applied Survey Research, 2011
Figure 6. Impact of K–1 Combined Attendance on Third Grade ELA Test Scores
The average student test score drops with each increase in K–1 absenteeism. Students with small to moderate risk fall slightly below proficiency level of 350. Students with chronic high risk fall significantly below proficiency level.
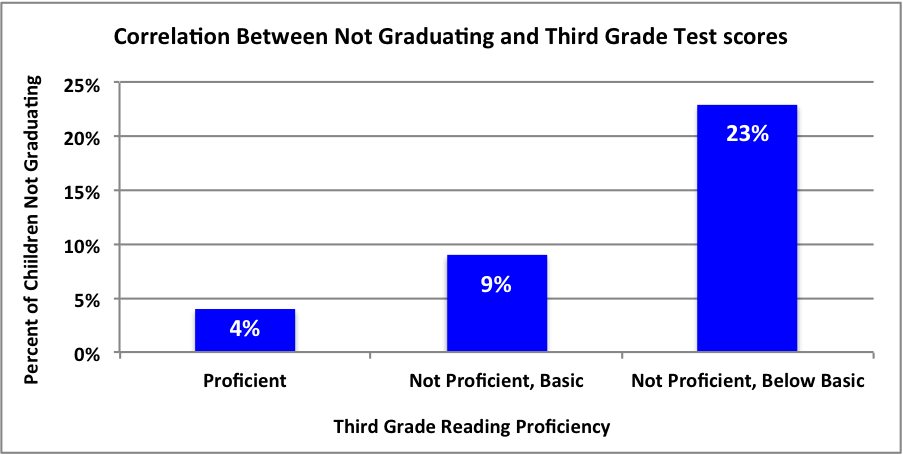
As discussed previously, the impact of falling behind in reading proficiency in third grade can have serious long-term consequences. Figure 7 examines high school graduation rates in relation to third grade reading proficiency scores. The results are dramatic.
Hernandez, 2011
Figure 7. Correlation between children not graduating high school and third grade reading proficiency
Third grade reading proficiency turns out to be a serious early warning for students at risk of not graduating from high school. Test scores are ranked in three categories: proficient, not proficient basic, and not proficient below basic. Only 4% of third graders at or above reading proficiency failed to graduate. That failure rate more than doubled to 9% for students who were not proficient basic. An astounding 23% of third grade students whose reading efficiency was below basic are predicted to fail to graduate, a rate that is almost 6 times the rate of students who are proficient.
Ninth Grade: Figure 8 examines the relationship between student absences in the eighth grade and academic performance (the Florida Comprehensive Assessment Test, or FCAT) in the ninth grade. The research by Balfanz and Byrnes (2012) was conducted for the 2000–2001 school year. The data show the familiar linear relationship between days missed and negative impact on test scores. Math scores seem to be even more sensitive than reading scores to absence rates. The authors found similar results from data analysis across other states and other subject areas (science and English).
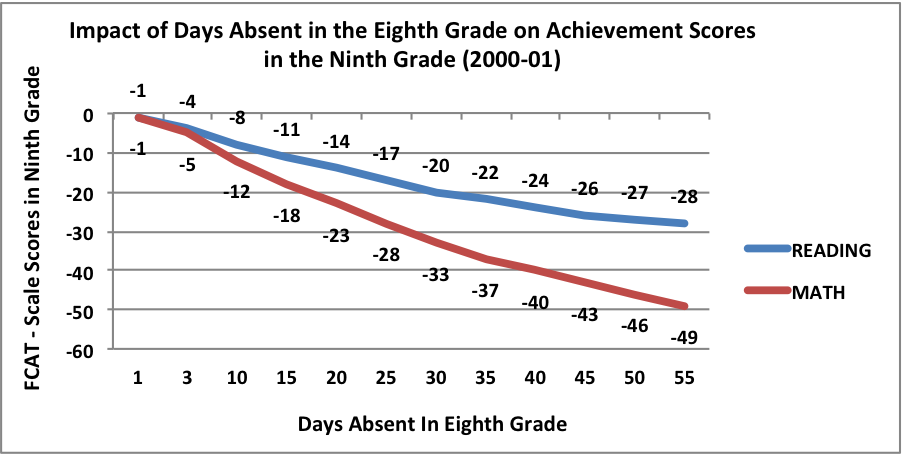
Balfanz & Brynes, 2012
Figure 8. Impact of days absent in eighth grade on achievement scores in ninth grade (2000–2001)
Fourth, Eighth, and Twelfth Grades: The National Center for Educational Statistics (Digest of Education Statistics, 2017) disaggregated the reading and math scores of the most recent National Assessment of Educational Progress (NAEP) exams (2017 for fourth and eighth grades, 2015 for twelfth grade) by the number of days a student was absent in the month prior to the exam.
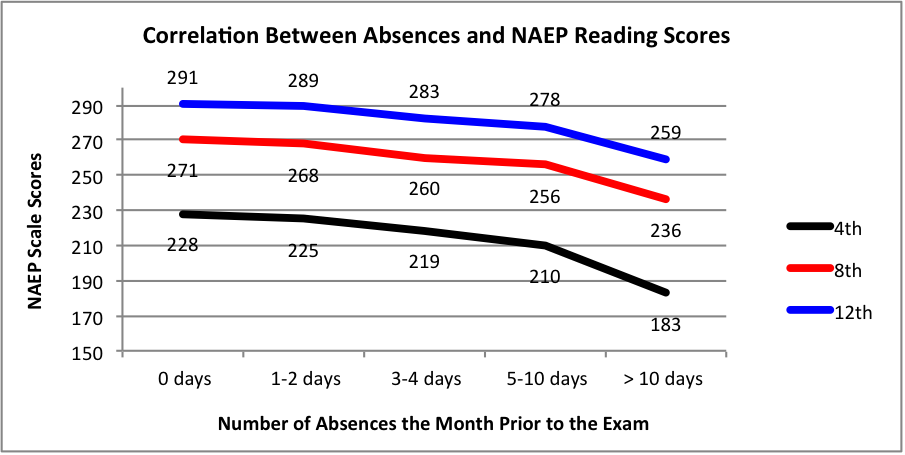
NAEP, 2017
Figure 9. NAEP reading scores by number of school days missed in the prior month
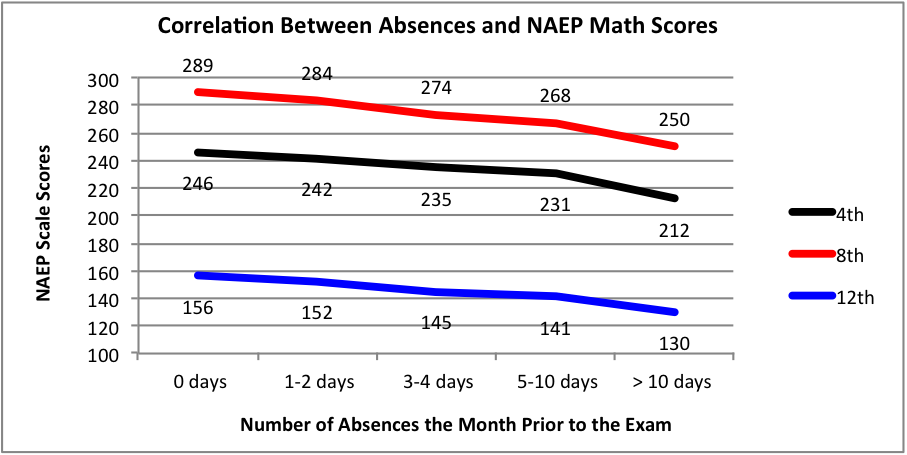
NAEP, 2015
Figure 10. NAEP math scores by number of school days missed in the prior month
Figures 9 and 10 show a clear relationship between student absences and test results. There are obviously many aspects of a child’s learning experience that contribute to his or her academic performance; yet, few variables are as straightforward or predictive as the negative impact of chronic absenteeism.
As noted earlier, these studies represent a small sample of the existing research documenting the negative impact of chronic absenteeism on academic performance. The evidence is as compelling as it is alarming.
GRADUATION RATES
Chronic absenteeism is one of the top early indicators of students at risk of not graduating high school (Baltimore Education Research Consortium, 2011). Even absenteeism in early grades can predict at-risk students. Figure 11 shows the correlation between sixth grade absenteeism and graduation.
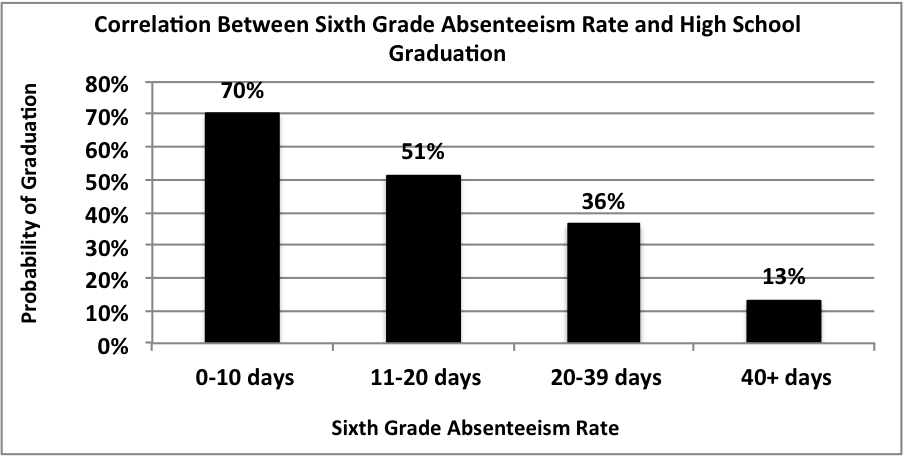
Baltimore Education Research Consortium, 2011
Figure 11. Sixth grade absenteeism rates and probability of graduation
In the Baltimore Education Research Consortium study, the probability of graduation dropped from 70% for students with 10 or fewer days absent in sixth grade to 36% percent for students who missed 20 to 39 days and to 13% for students who missed 40 or more days.
In Philadelphia, this correlation was confirmed by Balfanz, Herzog, and Mac Iver (2007); they found that only 17% of sixth graders who were severely chronically absent (20% absenteeism rate) graduated from high school.
Another Baltimore study (Mac Iver & Messel, 2012) demonstrated the correlation between student absences in the ninth grade and graduation rates; see Figure 12. This study broke down the absenteeism rate into much smaller, more detailed 5% increments. The data speak for themselves. Even small increases in absenteeism reduced the likelihood of a student graduating high school on time.
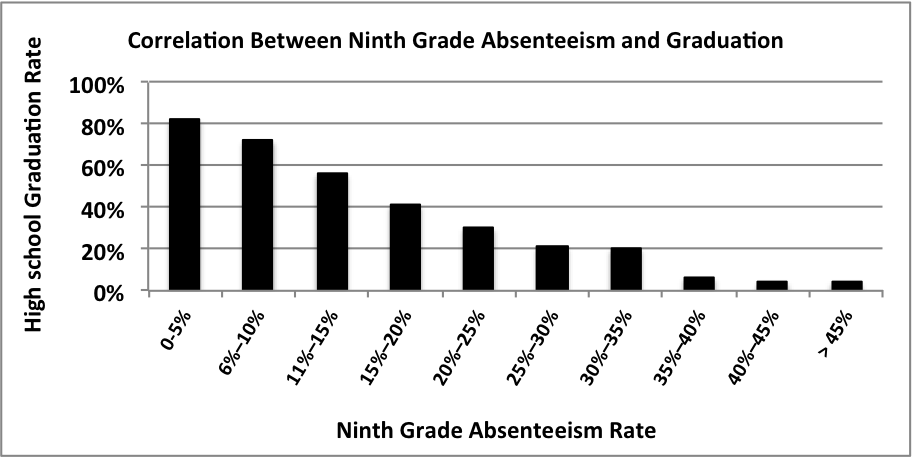
Mac Iver & Messel, 2012
Figure 12. Correlation between ninth grade absenteeism and graduation
SPILLOVER IMPACT ON CLASSROOM EFFECTIVENESS
Chronic student absenteeism does not occur in a vacuum, and it can have a negative impact on the academic performance of all students, not just those who are absent. The educational experiences of children who attend school regularly can be diminished when teachers divert their attention from the class as a whole to meet the learning and social needs of children who miss substantial amounts of school (Chang & Romero, 2008). Research documents this phenomenon:
• Chronically absent students require significant remediation when returning to school (Chen & Stevenson, 1995; Connell, Spencer, & Aber, 1994).
• Chronically absent students have higher rates of negative interactions and social disengagement when returning to school. To the degree that this leads to increased behavioral disruptions, instructional time for other students is further reduced. (Gottfried, 2014; Johnson, 2005)
• One of the first studies to examine the impact of chronically absent students on the academic performance of classmates found a negative spillover effect (Gottfried, 2015). Students in classrooms with higher percentages of chronic absentees had lower reading and math test scores.
HEALTH
The American Academy of Pediatrics recently issued a policy statement linking school attendance and good health (Allison & Attisha, 2019). After an extensive review of the evidence, the academy identified both short- and long-term health risks associated with chronic absenteeism. In the short term, the act of missing school is linked to increased unhealthy behaviors, including alcohol consumption, drug use, smoking, and risky sexual behavior. Teenage pregnancy, violence, unintentional injury, and suicide attempts are also associated with chronic absenteeism.
The negative impact on long-term health problems results from chronic absenteeism’s link to higher student dropout rates and lower graduation rates. There is an enormous amount of evidence linking an adult’s education attainment to health problems such as smoking, alcohol consumption, overweight, and diabetes, and increased mortality rate or lower life expectancy (Lawrence, Rogers, & Zajacova, 2016; Telfair & Shelton, 2012). Also, children who are chronically absent are 3.5 times more likely to be arrested or referred to the juvenile justice system (Robertson & Walker, 2018).
K–12 FUNDING
Public funding of K–12 schools is driven by individual state policies, and all funding formulas are based on student enrollment and/or attendance (Chingos & Blagg, 2017). But different states count students in different ways. California allocates funding based on average daily attendance (ADA), the average number of students attending each day. The ADA formula means that any student absence (excused, unexcused, suspension) reduces school district funding (Harris, 2016).
California’s state ADA in 2014–2015 was 95.22%, which means that an average of 4.78% of students were absent each day. Over a 6-year period (2008–2009 through 2013–2014), school districts lost an estimated $7.3 billion ($1.22 billion per year) in funding due to student absences (Harris, 2016). Full funding is based on 100% attendance, which is not realistic. But every increase of 1 percentage point (e.g., raising the ADA from 95.22% to 96.22%) translates into more than $250 million in additional education funding per year (Harris, 2016).
Los Angeles Unified School District (LAUSD) loses an enormous amount of potential funding due to absenteeism. The Report of the Independent Financial Review Panel (commissioned by LAUSD) concluded: “Moving from its current ratio of 94% to the statewide average of 95.2% would generate an additional $45 million per year in LCFF (local control funding formula) revenue for LAUSD” (Anguiano et al., 2015). A subsequent evaluation of the report stated, “A 14% chronic absence rate means the district lost out on a total of $630 million in revenue last year” (Snell, Smith, Koteskey, Joffe, & Bui, 2018). This projected loss was based on 100% attendance, which is unrealistic, but it does communicate the scale of dollars involved with even small improvements in absenteeism.
IMPACT MULTIPLIERS
A number of conditions exacerbate both the rate and impact of chronic absenteeism, especially when more than one occurs at a time. They include students who come from low-income families, experience high rates of school mobility (changing schools midyear), are homeless, and/or are caught in the school discipline suspension system.
Students from each category have higher than average levels of chronic absenteeism, along with resulting impact on student achievement. However, many students occupy more than one category. Low-income students may be homeless and experience a high rate of school mobility. It is when these categories are compounded that we see extraordinarily negative impacts; see Table 3 for an example.
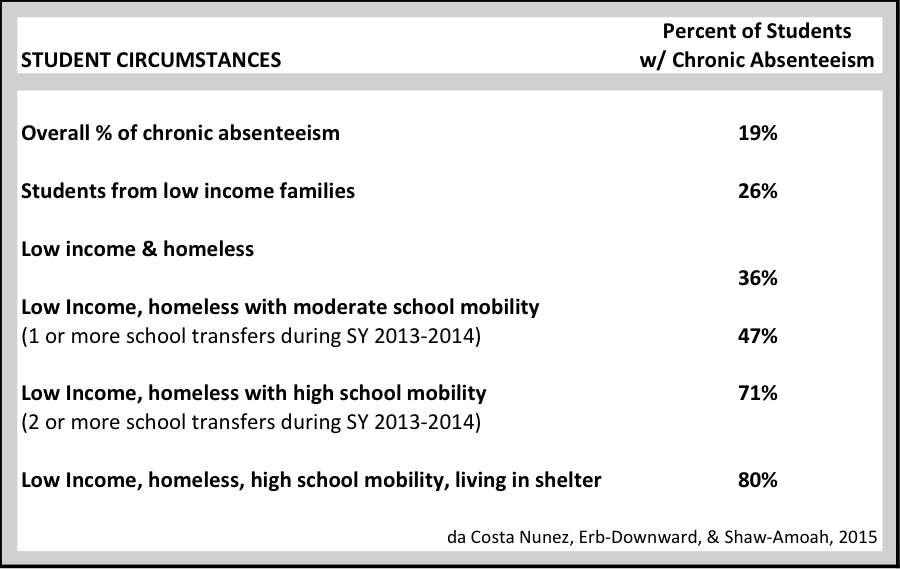
Table 3. Chronic absenteeism among elementary students by income, school mobility, and housing status (New York City)
Each additional circumstance elevates the likelihood that a student will be chronically absent. The most extreme conditions are homelessness, changing schools a lot, and living in a shelter. Four out of five students (80%) experiencing extreme conditions are likely to be chronically absent. This is not a small portion of the student population. A surprisingly large number of students live with one or more conditions that increase the likelihood of chronic absenteeism.
The challenges of homelessness and school mobility are still under the radar in most school districts—homelessness because it is a problem that has grown very quickly and school mobility because no one has connected the dots with existing data to recognize its impact.
LOW-INCOME IMPACT MULTIPLIER
When it comes to chronic absenteeism, children from low-income families face triple jeopardy:
• They often live in conditions that contribute to high rates of chronic absenteeism—lack of access to adequate health care, decent housing, food, clothing, family support, and transportation (Ready, 2010).
• They are much more likely to suffer from multiplier conditions—for example, changing schools midyear, homelessness, and suspensions—that exacerbate chronic absenteeism. Each condition also has its own negative impact on student achievement (Ready, 2010).
• The poverty-related conditions make it more difficult for these students to recover from lost school days as they lack resources to help them make up for the missing time. They suffer the highest rate of loss per individual absence (Ready, 2010).
The correlation between family income and chronic student absenteeism is unmistakable. The following analysis examines the rate of absenteeism as well as the percentage of chronic student absenteeism across incomes levels. The data are from the early childhood longitudinal study, kindergarten cohort (ECLS-K) produced by the National Center for Education Statistics. It tracked the same cohort of students from kindergarten through fifth grade.
Poor = Below 100% FPL Low Income = 100%–200% FPL
Romero & Lee, 2007
Figure 13. Chronic absenteeism as a function of family income
The largest absenteeism gap is in kindergarten, where students from the lowest income families miss an average of 2.8 days more per year than students from the highest income families. The gap narrows in subsequent years from a difference of 2.1 days in first grade, 1.1 days in third grade, and 1.3 days in fifth grade.
The following data on chronic absenteeism are much more illustrative of the significant discrepancy between low- and high-income students.
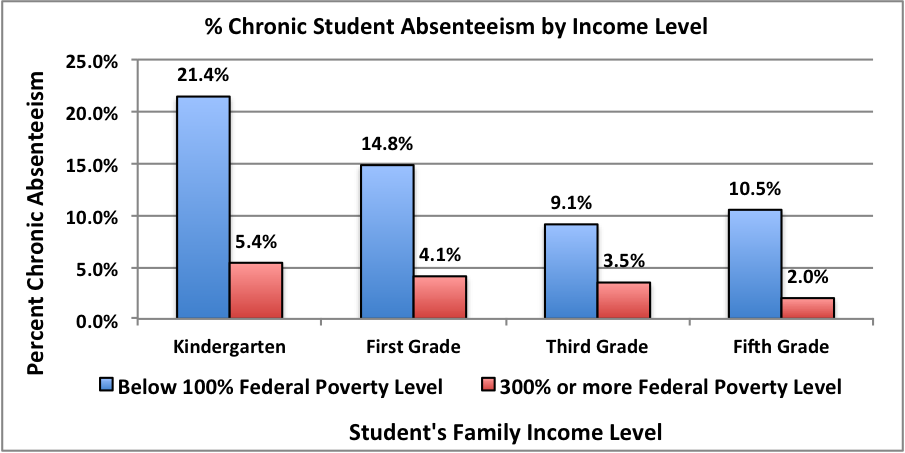
Romero, & Lee, 2007
Figure 14. Percent chronic absenteeism by income level
More than 21% (approximately one in five) of low-income kindergarten students, or 4 times the rate of high-income students, were chronically absent. The difference in absenteeism rates between the two income groups dropped in first and third grades; in first grade, 3.6 low-income students were chronically absent for every high-income student, and in third grade, 2.6 low-income students for every high-income student. However, the ratio went back up in fifth grade; 5.2 low-income students were chronically absent for every high-income student. The differences are significant.
The relationship between low-income students and chronic student absenteeism is also evident at the school level. Schools with a higher percentage of students from low-income backgrounds are much more likely to have chronic absenteeism issues than schools with lower percentages; see Figure 15. As shown in the figure, in 34% of high-poverty schools, 20% or more of the students were chronically absent. In low-poverty schools, only 8% of students were chronically absent. This pattern suggests a clear relationship: As the poverty level rises, so does the rate of chronic absenteeism.
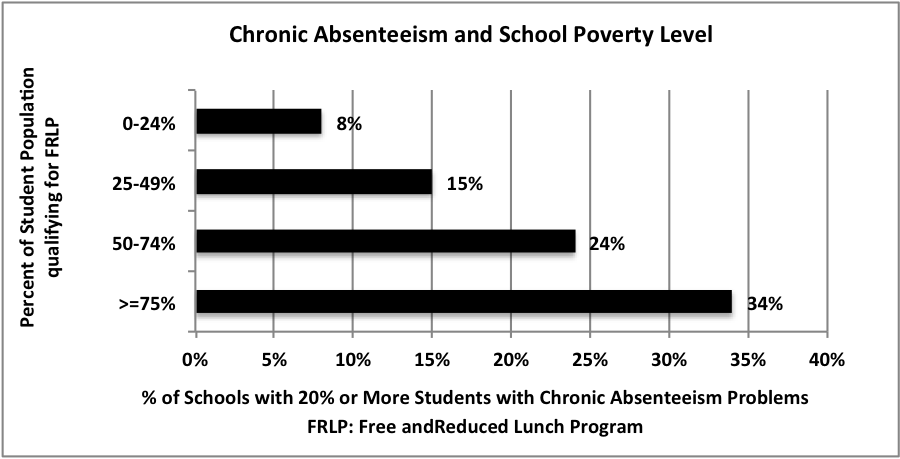
Attendance Works and Everyone Graduates Center, 2017
Figure 15. Percent of schools with chronic absenteeism by school poverty level
Research suggests that “school absences have stronger negative effects on socioeconomically disadvantaged children than their more advantaged peers” (Ready, 2010). A recent study, (Coelho, Fischer, McKnight, Matteson, & Schwartz, 2015), compared math test scores of third graders in Wisconsin with the number of days they missed in first grade. As shown in Figure 16, among students who missed the same number of days, the test scores of low-income students (eligible for Free and Reduced Lunch Program, or FLRP) deceased more sharply than those of higher income students (not eligible for FLRP). The low-income students lost .5 point on their math scores for each day missed whereas their higher income peers lost only .22 point per day.
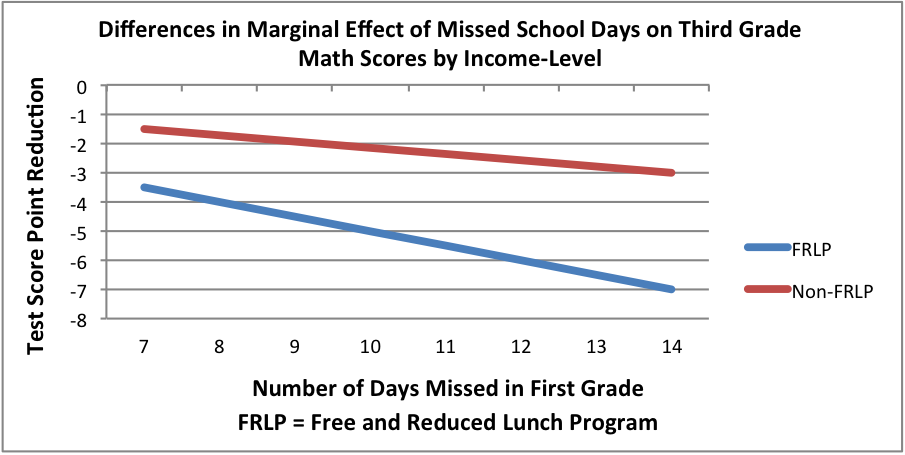
Coelho, Fischer, McKnight, Matteson, & Schwartz, 2015
Figure 16. Effect of missed school days in first grade on third grade math scores by income level (Wisconsin Knowledge and Concepts Examination, or WKCE)
Much research has documented the “summer learning loss” theory affecting socioeconomically disadvantaged children (Alexander, Entwisle, & Olsen, 2001; Burkam, Ready, Lee, & LoGerfo, 2004; Downey, von Hippel, & Broh, 2004). Studies show that formal schooling exerts a stronger influence on the academic growth of low-income children than on their peers. During the summer months, when the equalizing benefits of schooling are removed, cognitive disparities between disadvantaged and non-disadvantaged children widen further (Ready, 2010). It is not difficult to see the importance of chronic absenteeism in this model. As low-income students miss more school, they are likely to be under similar conditions as in the summer months and to lose ground they may never make up.
SCHOOL MOBILITY IMPACT MULTIPLIER
School mobility (also known as student mobility, school transfers, churn, and transience) is defined as a student changing schools for reasons other than promotional changes (graduating from elementary school to middle school or from middle school to high school). Basically, it refers to changing schools during a school year. Studies show that mobility has a significant negative effect on absenteeism as well as on academic achievement, task engagement, social engagement, and graduation. (Ashy, 2010; Fantuzzo, LeBoeuf, Chen, Rouse, & Culhane, 2012). Like chronic absenteeism, school mobility is an “invisible” factor overlooked by the education system. Some states (e.g., Colorado, Rhode Island, Utah) and cities systematically track, assess, and address this challenge, but they are the few exceptions.
Recent data document the scale of the school mobility problem at the national level. The U.S. Department of Education conducted a longitudinal study of a cohort of kindergarteners through the eighth grade (1998 to 2007), which included data on student mobility. Tourangeau, Nord, Lê, Sorongon & Najarian, 2009).
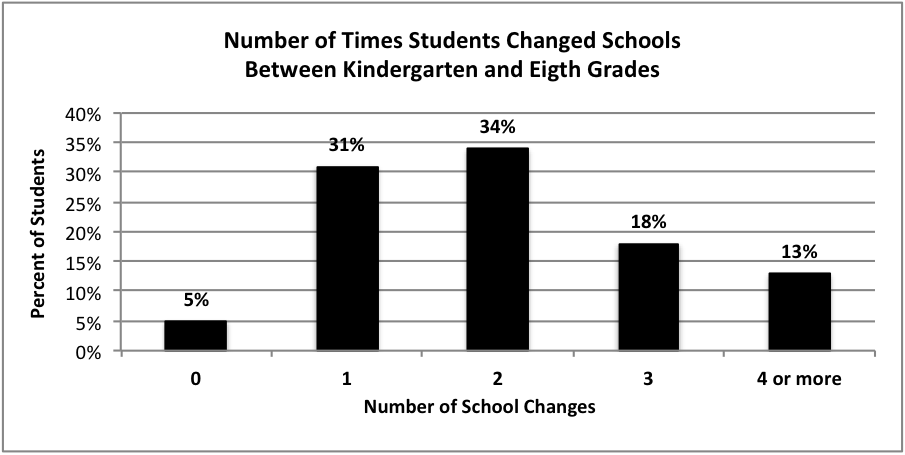
Ashby, C. M. (2010)
GAO analysis of ECLS-K data, 1998–2007
Figure 17. Number of times students changed schools between kindergarten and eighth grade
During the 8-year period, 31% of students changed schools three or more times, and 13% of that group changed schools four or more times. There is strong evidence linking high mobility and high absenteeism. The New York City Department of Education collected data demonstrating a link between school moves and missing school; simply put, the more times a student changed schools, the more likely that student was to be chronically absent (da Costa Nunez, Erb-Downward, & Shaw-Amoah., 2015, p. 4). Cross-sectional and longitudinal data from the Utah State Office of Education reinforce the relationship between school mobility and absenteeism, estimating that students who change schools one or more times during a school year are 4 times more likely to be chronically absent than students who do not change schools (Utah Education Policy Center [UEPC], 2012).
The ECLS-K data were also used to identify low and high mobility schools and their impact on student absences. High mobility schools are defined as having 10% or more of their eighth grade students leave before the end of the school year. About 11.5% of schools fit into the high mobility category.
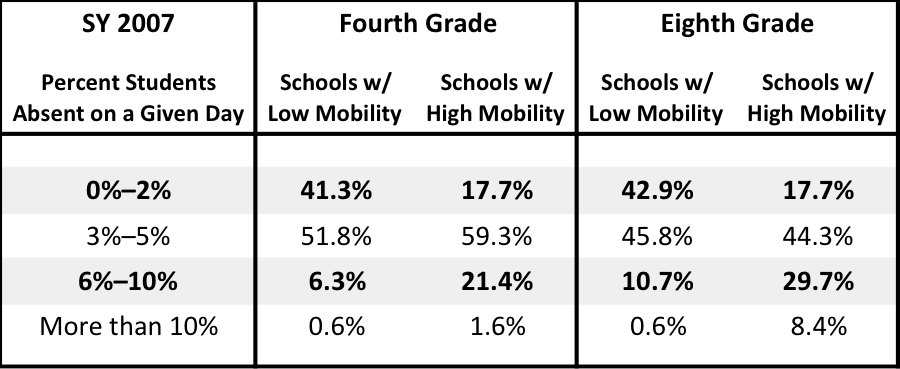
Ashby (2010)
Table 4. Student absenteeism by school mobility rates
Approximately 42% of low mobility schools (41.3% fourth grade, 42.9% eighth grade) had low student absenteeism (0% to 2%) compared with only 17.7% of schools (fourth and eighth grades) with high mobility, a difference of roughly 25 percentage points and a factor of over two to one. High mobility schools were 3 times more likely than low mobility schools to have a daily absenteeism rate of 6% to 10%,
Although high mobility is most often associated with a wide range of factors related to poverty, there are many reasons for students changing schools, each calling for a customized intervention. Table 5 identifies various types of school transfers, from voluntary to involuntary and from student/family initiated to school initiated. This isn’t a comprehensive list but serves to highlight the need for systematic data collection and analysis for each student.
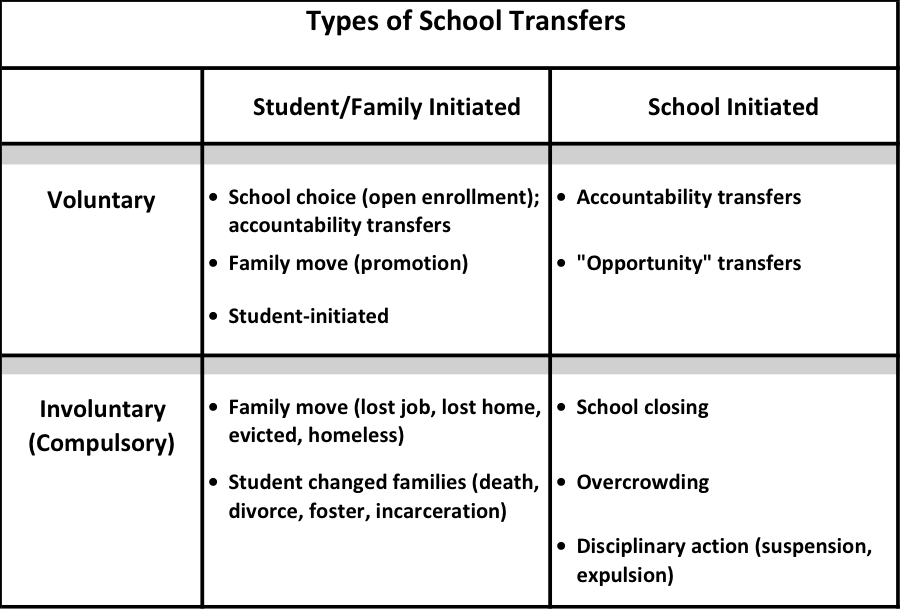
Rumberger, 2015
Table 5. Types of school transfers
HOMELESSNESS IMPACT MULTIPLIER
There were 1.3 million homeless students in the 2015–2016 school year. From 2009–2010 through 2015–2016, the number of homeless students in K–12 grew by almost 400,000, an increase of 43%. Their proportion of the total student population grew from 1.8% to 2.6% during those years (NCES, 2017). The data trend suggests this is a significant, and growing, population with unique and challenging needs. Among these challenges, homeless students have the single highest chronic absenteeism rate of any student category.
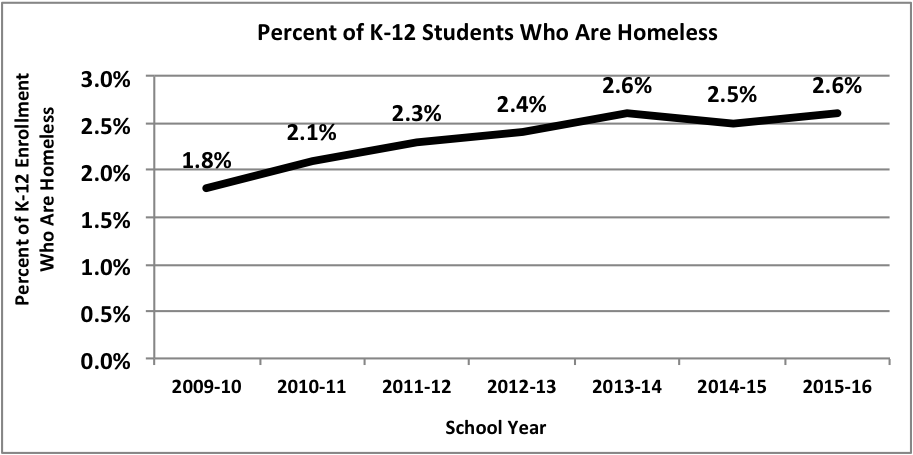
NCES Digest of Education Statistics, 2017: Table 204.75a
Figure 18. Percent of K–12 students who are homeless
In association with New York City public schools, the Institute for Children, Poverty, and Homelessness (ICPH) produced a detailed report on the relationship between homelessness and student chronic absenteeism entitled Empty Seats: The Epidemic of Absenteeism Among Homeless Elementary Students (da Costa Nunez et al., 2015). The data in Figure 19 is for K–5 students in the 2013–2014 school year.
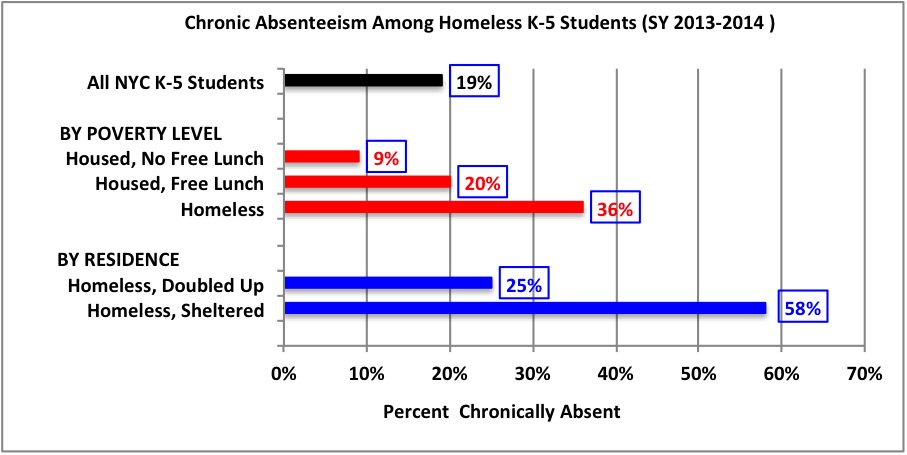
da Costa Nunez et al., 2015
19. Chronic absenteeism among homeless K-5 students (2013–2014)
Nineteen percent of New York City’s K–5 public school students were chronically absent, which is substantially higher the national average of twelve percent. Thirty-six percent of the city’s homeless children were chronically absent, twice the overall citywide rate. At the national level, the rate of chronic student absences among homeless students was more than twice that of the non-homeless student population (da Costa Nunez et al., 2015; UEPC, 2012).
Figure 19 examines student absence rates by family income level using the Free and Reduced Lunch Program (FRLP) benchmark. Students whose families did not qualify for FRLP were classified as low poverty, and those who did as high poverty. Homeless students were 4 times more likely to be chronically absent than students living in low-poverty homes, and almost twice as likely as those living in high-poverty homes. The impact of homelessness clearly goes beyond just poverty.
An additional factor to consider is where a homeless student resides. As shown in Figure 19, 58% of homeless students living in shelters had chronic absenteeism problems. Students who were living “doubled up” had less than half that rate (25%). Doubling up describes living with another family or other person due to economic hardship or loss of housing.
The ICPH report also showed that school mobility was a more severe problem among homeless students (see Figure 20). Homeless students overall were almost 3 times more likely to have one or more school transfers than the New York City average for K–5 students (27% compared with 10%). Students living in shelters were nearly 4 times more likely to move schools in a year (38% compared with 10%).
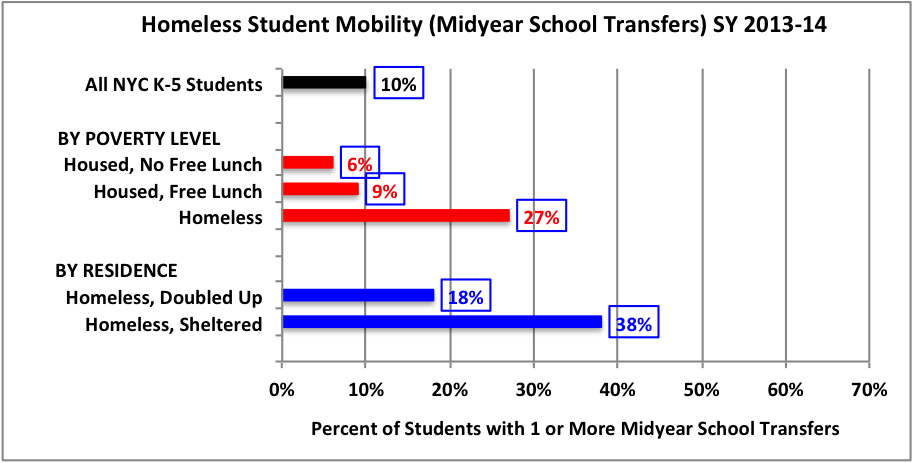
da Costa Nunez et al., 2015
Figure 20. Homeless student mobility (midyear school transfers), 2013–2014
Calculating the combined impact that living in a homeless shelter and transferring schools has on chronic student absenteeism produces some astounding numbers. Among students with two or more school transfers, 80% of those living in shelters and 71% of all students who were homeless had chronic attendance problems. For students with one or more school transfers, the percentages dropped to 61% for those living in shelters and to 47% for all students who were homeless (da Costa Nunez et al., 2015).
STUDENT SUSPENSIONS IMPACT MULTIPLIER
Until very recently, the education system did not closely track the use, scale, and impact of its student discipline policies. In 2018, a detailed analysis produced startling data. School children lost more than 11 million days of instruction during the 2015–2016 school year as a result of out-of-school disciplinary suspensions (Losen & Whitaker, 2018). Given the negative impact of chronic absenteeism, a disciplinary strategy that calls for removing students from school is counterproductive to say the least.
The data also show a significant disparity when analyzed by ethnicity and disability. Figure 21 illustrates the number of days of instruction lost from suspensions per 100 students enrolled. The national average of lost instruction was 23 days per 100 students enrolled. The rates of suspension were disproportionately high for Black students and students with disabilities. Black students lost almost 5 times more instructional days than White students, and 3 times more days than the national average. Students with disabilities lost twice the amount of days as students without disabilities. In terms of impact, a recent report by the Government Accountability Office (Nowicki, 2018) concluded that students suspended from school “lose important instructional time, are less likely to graduate on time, and more likely to repeat a grade, drop out of school, and become involved in the juvenile justice system.”
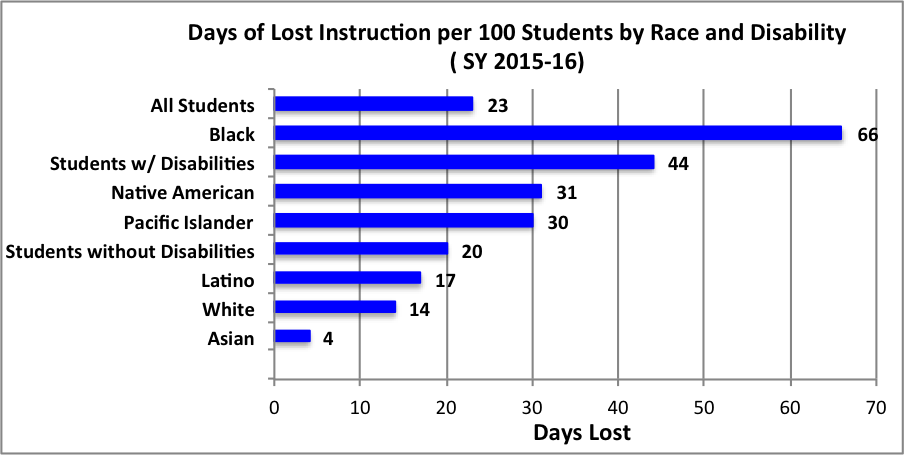
Losen & Whitaker, 2018
Figure 21. Days of lost instruction per 100 students by race and disability (2015–2016)
INTERVENTION CORE COMPONENTS
Successful interventions must be dynamic, data driven, and customized to the unique opportunities and challenges of every student and school. There are, however, critical components that all interventions require to be effective. They include (1) policies defining absenteeism and accountability, (2) a multi-tiered model for coordinating activities and services, (3) ongoing real-time data analysis to identify needs and direct interventions, and (4) evidence-based interventions.
1. Adopt policies to increase accountability at the federal, state, and local policy levels for reducing chronic absenteeism.
Although federal and state policies are often complicated and somewhat unpredictable, they do drive behavior at the local level in terms of goals, measurements, interventions, and funding. After being ignored for so long, chronic absenteeism has come into focus in some recent developments in public policy.
From 2002–2015, No Child Left Behind (NCLB) required schools to report on graduation rates and student performance in reading and math as documented on standardized tests. However, it did not have any requirements for tracking, monitoring, or addressing student absences. In 2015, NCLB’s successor legislation, Every Student Succeeds Act (ESSA), broadened accountability requirements. It requires states to measure five metrics annually: (1) reading and math achievement, (2) graduation rates from secondary schools, (3) an additional academic indicator for pre-secondary schools, (4) a metric for improving English language proficiency of English language learners, and (5) at least one state-chosen metric of school quality or student success (SQSS). Thirty-six states, the District of Columbia, and Puerto Rico included chronic absenteeism as either one of or their only SQSS indicator. (Bauer, Liu, Whitmore, Schanzenbach, & Shambaugh, 2018).
As always, the challenge is in implementation. ESSA gives states maximum flexibility in defining SQSS indicators, deciding how to measure them, changing them from year to year, and discontinuing them at will. There are already examples of definitions that, while well intentioned, miss the point of the research. If a student in New Jersey is absent because of take-your-child-to-work day, a college visit, a religious holiday, or any other guideline issued by the commissioner of education, that absence does not count against chronic absence (Bauer et al., 2018). Some reasons for school absence are more positive than others, but, from the negative impact that nonattendance can have on students, an absence is an absence.
States are required to include rates of chronic absenteeism on each school report card using the federal definition, which counts all absences, whether excused or not (National Forum on Education Statistics, 2009). Using this definition, states must also report rates of chronic absenteeism to the U.S. Department of Education as part of its Civil Rights Data Collection (CRDC).
2. Implement a school-wide multi-tiered model that drives data collection, resource allocation, interventions, and evaluation to reduce chronic student absenteeism.
The multi-tiered tiered system is a proven model for addressing system-wide chronic absenteeism issues with students of various needs and capabilities (Kearney, 2016; Kearney & Graczyk, 2014). The model is based on the assumption that there are different categories of need requiring different levels and intensities of intervention. It is cost-effective, makes good use of limited resources, and is customized to address specific school and student needs. There are numerous versions of this type of model, but the following is one of the more developed and tested (Attendance Works, 2018).
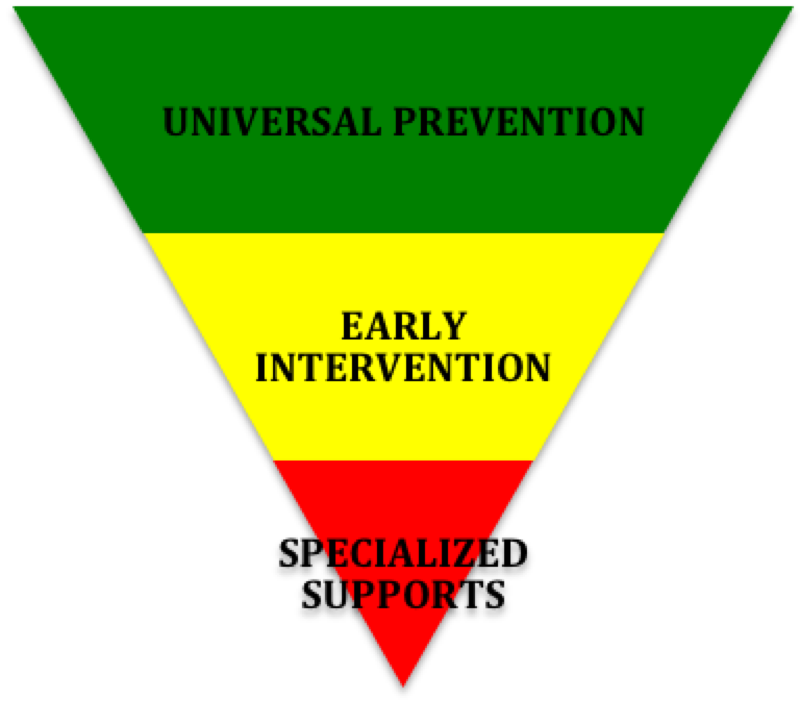
UNIVERSAL PREVENTION: School/classroom-wide systems for all students, staff, parents, and settings
EARLY INTERVENTION: Specialized group systems for students at risk of chronic absenteeism
SPECIALIZED SUPPORTS: Specialized, individualized interventions for chronically absent students
3. Implement a real-time data feedback system to identify and monitor individual student absenteeism, identify factors contributing to chronic absences, and assess the effectiveness of interventions at the school and student level.
Ongoing performance feedback is essential to all three multilevel tiers: prevention, early intervention, and specialized support:
Prevention: The data feedback system tracks absence data (date, type, etc.) for all students, every day. It is reviewed frequently. Tracking chronic student absenteeism is a moving target, and early intervention is a critical component for successful outcomes. Factors change in students’ lives. Absenteeism problems can suddenly appear in students who have never had problems in the past, or in students whose problems had been resolved. The system should also track the effectiveness of schoolwide prevention interventions.
Early Intervention: The data feedback system is extended to students at risk of and/or exhibiting chronic absenteeism. Factors contributing to absences may come from a wide range of areas (individual, family, school, community) and specific factors (home, health, school). Students may have combinations of issues that need to be addressed. The following is a more detailed list of the types of contributors to absenteeism (Attendance Works and Everyone Graduates Center, 2018). It is not meant to be all-inclusive.
Barriers
• Illness, both chronic and acute
• Lack of physical health, mental health, vision, or dental care
• Trauma
• Unsafe path to and from school
• Poor transportation
• Frequent moves or school changes
• Involvement with child welfare or juvenile justice system
Negative School Experiences
• Struggling academically or socially
• Bullying
• Suspensions and expulsions
• Negative attitudes of parents due to their own school experience
• Undiagnosed disability
• Lack of appropriate accommodations for disability
• School climate
• Facilities (condition of the school building)
Lack of Engagement
• Lack of culturally engaging instruction
• No meaningful relationship with adults in school
• Stronger ties with peers out of school than in school
• Failure to earn credits/no future plans
• Many teacher absences or long-term substitutes
• Ineffective teaching
Misconceptions
• Absences are only a problem if they are unexcused
• Missing 2 days a month doesn’t affect learning
• Sporadic absences aren’t a problem
• Attendance only matters in the older grades
• Kindergarten is optional
Early Intervention and Specialized Supports: Monitoring interventions closely in terms of fidelity and outcomes is critical (Kearney, 2016; Kearney & Graczyk 2014). While embracing evidence-based practice, the system also needs to support practice-based evidence, which involves tracking data on the implementation and outcomes of interventions while they are in place. The data are then used to evaluate and modify the intervention as indicated. This is important for a number of reasons: (1) There is still not much research on the effectiveness of specific interventions; (2) every intervention is unique, as student circumstances vary; and (3) it is impossible to know if an intervention is working without also knowing if it is being implemented correctly.
4. Adopt evidence-based interventions that are customized, evaluated in terms of fidelity and outcomes, and dynamic to change as the data suggest.
Adopting effective interventions may seem simple and straightforward, but in reality it is extremely complex. There is a great deal of variability in the system. The characteristics of each student, classroom, and school are unique, as are the individual needs and challenges contributing to absenteeism. However, there are broad categories of interventions.
Universal Prevention
• Establish a school culture supporting student attendance
• Collect and analyze data on all students’ attendance, identifying students at risk of chronic absenteeism
• Engage family positively, reinforcing the value of attendance and communicating about student absences in real time
• Create incentives to reinforce attendance
• Collaborate with community partners to provide individual supports when necessary
Early Intervention
• Monitor excused and unexcused absence data
• Help parents understand the impact of absences on achievement
• Establish positive relationships with students and families
• Create an engaging school climate
• Recognize good and improved attendance
• Identify and address common barriers
Specialized Supports
• Coordinate school and interagency responses
• Intervene legally as a last resort
FINAL THOUGHTS: CONTEXT
The twenty first century has seen unprecedented efforts at large scale school reform. It began in 2001 with the passage of No Child Left Behind (NCLB), which introduced federal accountability standards for individual school performance as well as consequences for schools that failed to make “Adequate Yearly Progress (AYP)”. NCLB put a spot light on the lack of achievement and progress in public education and mandated school improvement plans for underperforming schools. The federal activist pace accelerated under the Obama administration, which encouraged states to initiate specific reforms by using the “waiver” provision on NCLB, the Race to the Top Initiatives ($ 4.35 billion), and School Improvement Grants ($ 3 billion). (Hess & McShane, 2018).
The resulting range of school reform initiatives has been stunning, including: class size reduction, charter schools, additional school funding, efforts to change teacher preparation, teacher evaluation, common core curriculum, different school models, school choice, privatization, vouchers, etc. As diverse as they are, most have the following characteristics in common. They are complicated, require a lot of moving parts, expensive, and have had limited success improving overall school performance. (Gottfried & Hutt, 2019). In addition, they were faced significant disagreements among education stakeholders based on philosophies, ideologies, politics, special interests, etc.
It is in this context that the issue of chronic student absenteeism stands out. It highlights a significant failure in our attempts at school reform. It also offers an opportunity for improving student achievement that sidesteps many of the obstacles that have plagued school reform efforts to date.
The failure was the education system’s inability to identify, track and intervene with an issue as fundamental as student absenteeism. The fact that this issue has reached the point where one in seven students is chronically absent is a fairly large indictment of the system. The system was not responsive to decades of research documenting the significant negative impact of student absenteeism on academic achievement, emotional development, graduation, health, and long-term success (Gottfried, 2015). The result is that school reform efforts completely missed one of the most important metrics for student success.
The opportunity that presents itself is facilitated by a recent awareness and focus on chronic student absenteeism at all levels of the education system (district, city, state, federal). It is included as a school quality or student success (SQSS) metric in thirty-six states’ plans for compliance with the Every Student Succeeds Act (ESSA). Addressing the issue of chronic student absenteeism is not simple or easy, but compared to other reform efforts it is straightforward. It is an area of intervention that minimizes the distractions of ideologies, politics, and special interests. Relative to most past school reform efforts, they are achievable and cost-effective. It is one of those rare opportunities that seldom comes along.
CITATIONS
Alexander, K. L., Entwisle, D. R., & Olson, L. S. (2001). Schools, achievement, and inequality: A seasonal perspective. Educational Evaluation and Policy Analysis, 23(2), 171–191.
Allison, M. A., Attisha, E., & AAP Council on School Health. (2019). The link between school attendance and good health. Pediatrics, 143(2). e20183648
Anguiano, M., Eastin D., Fine, M, Lockyer, B., Robles, D., Santana, M.,…Wong, K. (2015). Los Angeles Unified School District Report of the Independent Financial Review Panel. Los Angeles, CA: Los Angeles Unified School District.
Applied Survey Research. (2011). Attendance in early elementary grades: Associations with student characteristics, school readiness, and third grade outcomes. San Francisco, CA: Attendance Works.
Ashby, C. M. (2010). K–12 education: Many challenges arise in educating students who change schools frequently.Report to Congressional Requesters (GAO-11-40). Washington, DC: Government Accountability Office.
Attendance Works. (2018).3 tiers of intervention.Retrieved from https://www.attendanceworks.org/chronic-absence/addressing-chronic-absence/3-tiers-of-intervention/
Attendance Works and Everyone Graduates Center. (2017). Portraits of change: Aligning school and community resources to reduce chronic absence.Retrieved from https://www.attendanceworks.org/portraits-of-change/
Balfanz, R., & Byrnes, V. (2012). The importance of being in school: A report on absenteeism in the nation’s public schools. Baltimore, MD: Johns Hopkins University Center for Social Organization of Schools.
Balfanz, R., & Byrnes, V. (2013). Meeting the challenge of combating chronic absenteeism: Impact of the NYC mayor’s interagency task force on chronic absenteeism and school attendance and its implications for other cities. Baltimore, MD: Johns Hopkins School of Education.
Balfanz, R., Durham, R., & Plank, S. (2008). Lost days: Patterns and levels of chronic absenteeism among Baltimore City public school students 1999-00 to 2005-06. Baltimore, MD: Baltimore Education Research Consortium.
Balfanz, R., Herzog, L., & Mac Iver, D. J. (2007). Preventing student disengagement and keeping students on the graduation path in urban middle-grades schools: Early identification and effective interventions. Educational Psychologist, 42(4), 223–235.
Baltimore Education Research Consortium. (2011). Destination graduation: Sixth grade early warning indicators for Baltimore city schools. Their prevalence and impact. Baltimore, MD: Author.
Bauer, L., Liu, P., Whitmore Schanzenbach, D., & Shambaugh, J. (2018). Reducing chronic absenteeism under the every student succeeds act. The Hamilton Project. Washington, DC: Brookings Institute. Retrieved from http://www.hamiltonproject.org/assets/files/reducing_chronic_absenteeism_under_the_every_student_succeeds_act.pdf
Buehler, M. H., Tapogna, J., Chang, H. N., & ECO Northwest, Ltd. (2012). Why being in school matters: Chronic absenteeism in Oregon Public Schools. Attendance Works.
Burkam, D. T., Ready, D. D., Lee, V. E., & LoGerfo, L. (2004). Social-class differences in summer learning between kindergarten and first grade: Model specification and estimation. Sociology of Education, 77(1), 1–31.
Chang, H. N., Bauer, L., & Byrnes, V. (2018). Data matters: Using chronic absence to accelerate action for student success.Attendance Worksand Everyone Graduates Center.
Chang, H. N., & Romero, M. (2008). Present, engaged, and accounted for: The critical importance of addressing chronic absence in the early grades.New York, NY: National Center for Children in Poverty.
Chen, C., & Stevenson, H. W. (1995). Motivation and mathematics achievement: A comparative study of Asian‐American, Caucasian‐American, and East Asian high school students. Child Development, 66(4), 1215–1234.
Chingos, M., & Blagg, K. (2017). Making sense of state school funding policy.Washington, DC: Urban Institute.
Coelho, R., Fischer, S., McKnight, F., Matteson, S., & Schwartz, T. (2015). The effects of early chronic absenteeism on third-grade academic achievement measures.Madison, WI: Robert M. La Follette School of Public Affairs, University of Wisconsin.
Connell, J. P., Spencer, M. B., & Aber, J. L. (1994). Educational risk and resilience in African‐American youth: Context, self, action, and outcomes in school. Child Development, 65(2), 493–506.
da Costa Nunez, R., Erb-Downward, J., & Shaw-Amoah, A. (2015). Empty seats: The epidemic of absenteeism among homeless elementary students. New York, NY: Institute for Children, Poverty & Homelessness. Retrieved from https://www.attendanceworks.org/wp-content/uploads/2017/12/ICPH-Policy-Report_Empty-Seats_Chronic-Absenteeism.pdf
Digest of Education Statistics. (2017). Homeless students enrolled in public elementary and secondary schools, by grade, primary nighttime residence, and selected student characteristics: 2009-10 through 2015–16.Table 204.75a.Washington, DC: U.S. Department of Education, National Center for Education Statistics.
Downey, D. B., von Hippel, P. T., & Broh, B. A. (2004). Are schools the great equalizer? Cognitive inequality during the summer months and the school year. American Sociological Review, 69(5), 613–635.
Durán-Narucki, V. (2008). School building condition, school attendance, and academic achievement in New York City public schools: A mediation model. Journal of environmental psychology, 28(3), 278–286.
Epstein, J. L. & Sheldon, S. B. 2002. Present and accounted for: Improving student attendance through family and community involvement. Journal of Educational Research 95(5): 308–318.
Fantuzzo, J. W., LeBoeuf, W. A., Chen, C. C., Rouse, H. L., & Culhane, D. P. (2012). The unique and combined effects of homelessness and school mobility on the educational outcomes of young children. Educational Researcher, 41(9), 393–402.
Fiester, L. (2010). Early warning! Why reading by the end of third grade matters.Kids Count special report. Baltimore, MD: Annie E. Casey Foundation.
GAO, (1994) Elementary school children: Many change schools frequently, harming their education,GAO/HEHS-94-45 (Washington, D.C.: Feb. 4, 1994).
Ginsburg, A., Jordan, P., & Chang, H. (2014). Absences Add Up: How School Attendance Influences Student Success. Attendance Works.
Gottfried, M. A. (2010). Evaluating the relationship between student attendance and achievement in urban elementary and middle schools: An instrumental variables approach. American Educational Research Journal, 47(2), 434–465.
Gottfried, M. A. (2014). Chronic absenteeism and its effects on students’ academic and socio-emotional outcomes. Journal of Education for Students Placed at Risk (JESPAR), 19(2), 53–75.
Gottfried, M. A. (2015). Chronic absenteeism in the classroom context: Effects on achievement. Urban Education,54(1), 3–34.
Gottfried, M. A. & Hutt, E.L. (Eds.). (2019). Absent from school: Understanding and addressing student absenteeism.Cambridge, MA: Harvard Education Press.
Harris, Kamala. (2016). In School + On Track 2016.Sacramento, CA: Office of the Attorney General, State of California Department of Justice.
Henderson, T., Hill, C., & Norton, K. (2014). The connection between missing school and health: A review of chronic absenteeism and student health in Oregon.Portland, OR: Upstream Public Health.
Hernandez, D. (2011). Double jeopardy: How third-grade reading skills and poverty influence high school graduation.Baltimore, MD: Annie E. Casey Foundation.
Hess, F. M., & McShane, M. Q. (2018), Bush-Obama school reform: Lessons learned.Cambridge, MA: Harvard Education Press.
Johnson, G. M. (2005). Student alienation, academic achievement, and WebCT use. Journal of Educational Technology & Society, 8(2), 179–189.
Kearney, C. A. (2016). Managing school absenteeism at multiple tiers: An evidence-based and practical guide for professionals. New York City, NY: Oxford University Press.
Kearney, C. A., & Graczyk, P. (2014). A response to intervention model to promote school attendance and decrease school absenteeism. Child & Youth Care Forum,43(1), 1–25.
Lawrence, E. M., Rogers, R. G., & Zajacova, A. (2016). Educational attainment and mortality in the United States: Effects of degrees, years of schooling, and certification. Population Research and Policy Review, 35(4), 501–525.
London, R, A., Sanchez, M., & Castrechini, S. (2016). The dynamics of chronic absence and student achievement. Education Policy Analysis Archives, 24(112), 1–27.
Losen, D. J., & Whitaker, A. (2018). 11 million days lost: Race, discipline, and safety at U.S. public schools. A joint report by the Center for Civil Rights Remedies of UCLA’s Civil Rights Project and the American Civil Liberties Union of Southern California.
Mac Iver, M. A., & Messel, M. (2012). Predicting high school outcomes in the Baltimore city public schools.The Senior Urban Education Research Fellowship Series. Volume VII. Washington, DC: Council of the Great City Schools.
NAEP Data Explorer, 2015 and 2017 mathematics and reading assessments. Washington, DC: U.S. Department of Education, National Center for Education Statistics, National Assessment of Educational Progress (NAEP). Retrieved from https://nces.ed.gov/nationsreportcard/naepdata/
NAEP Data Explorer, 2015 and 2017 reading and mathematics scale scores of 4th, 8th, and 12th graders and percentage absent from school, by selected characteristics and number of days absent in the last month. Table 227.50. Washington, DC: U.S. Department of Education, National Center for Education Statistics, National Assessment of Educational Progress (NAEP). Retrieved from https://www2.ed.gov/datastory/chronicabsenteeism.html#one
National Forum on Education Statistics. (2009). Every school day counts: The forum guide to collecting and using attendance data (NFES 2009–804). Washington, DC: U.S. Department of Education, National Center for Education Statistics.
Nowicki,J. M. (2018). K–12 Education: Discipline disparities for Black students,boys, and students with disabilities. Report to Congressional Requesters. GAO-18-258. Washington, DC: Government Accountability Office.
Olsen, L. S. (2014). Why September matters: Improving student attendance.Policy brief. Baltimore, MD: Baltimore Education Research Consortium.
Office for Civil Rights. (2016). 2013–2014 civil rights data collection: A first look.
Railsback J. (2004). Increasing student attendance: Strategies from research and practice.Northwest Regional Educational Laboratory. Portland, OR.
Ready, D. D. (2010). Socioeconomic disadvantage, school attendance, and early cognitive development: The differential effects of school exposure. Sociology of Education 83(4): 271–286.
Robertson, A. A., & Walker, C. S. (2018). Predictors of justice system involvement: Maltreatment and education. Child Abuse & Neglect, 76, 408–415.
Robinson, C. D., Lee, M. G., Dearing, E., & Rogers, T. (2018). Reducing student absenteeism in the early grades by targeting parental beliefs. American Educational Research Journal, 55(6), 1163–1192.
Rogers, T., & Feller, A. (2018). Reducing student absences at scale by targeting parents’ misbeliefs. Nature Human Behaviour, 2(5), 335.
Romero, M., & Lee, Y. (2007). A national portrait of chronic absenteeism in the early grades.New York, NY: National Center for Children in Poverty, the Mailman School of Public Health at Columbia University.
Rumberger, R. W. (2015). Student mobility: Causes, consequences, and solutions. Boulder, CO: National Education Policy Center, University of Colorado.
Snell L., Smith, G. A., Koteskey, T., Joffe, M., & Bui, T. (2018). A 2018 evaluation of LAUSD’s fiscal outlook: Revisiting the findings of the 2015 Independent Financial Review Panel.Los Angeles, CA: Los Angeles Unified School District.
Telfair, J., & Shelton, T. L. (2012). Educational attainment as a social determinant of health. North Carolina Medical Journal, 73(5), 358–365.
Tourangeau, K., Nord, C., Lê, T., Sorongon, A. G., & Najarian, M. (2009). Early Childhood Longitudinal Study, Kindergarten Class of 1998-99 (ECLS-K): Combined User's Manual for the ECLS-K Eighth-Grade and K-8 Full Sample Data Files and Electronic Codebooks. NCES 2009-004. National Center for Education Statistics.
U.S. Department of Education. (2008). A uniform, comparable graduation rate: How the final regulations for Title I hold schools, districts, and states accountable for improving graduation rates. Retrieved from https://www2.ed.gov/policy/elsec/reg/proposal/uniform-grad-rate.html
U.S. Department of Education, Office for Civil Rights, 2013–2014 Civil Rights Data Collection. A First Look; Key Data Highlights on Equity and Opportunity Gaps in Our Nation’s Public Schools.Retrieved from https://www2.ed.gov/about/offices/list/ocr/docs/2013-14-first-look.pdf
U.S. Department of Education, Office for Civil Rights, 2015–2016 Civil Rights Data Collection. Chronic absenteeism in the nation’s schools: A hidden educational crisis. Retrieved from https://www2.ed.gov/datastory/chronicabsenteeism.html#one
Utah Education Policy Center [UEPC]. (2012). Research brief: Chronic absenteeism.Retrieved from https://www.schools.utah.gov/file/31291767-087c-4edb-8042-87f272507c1d